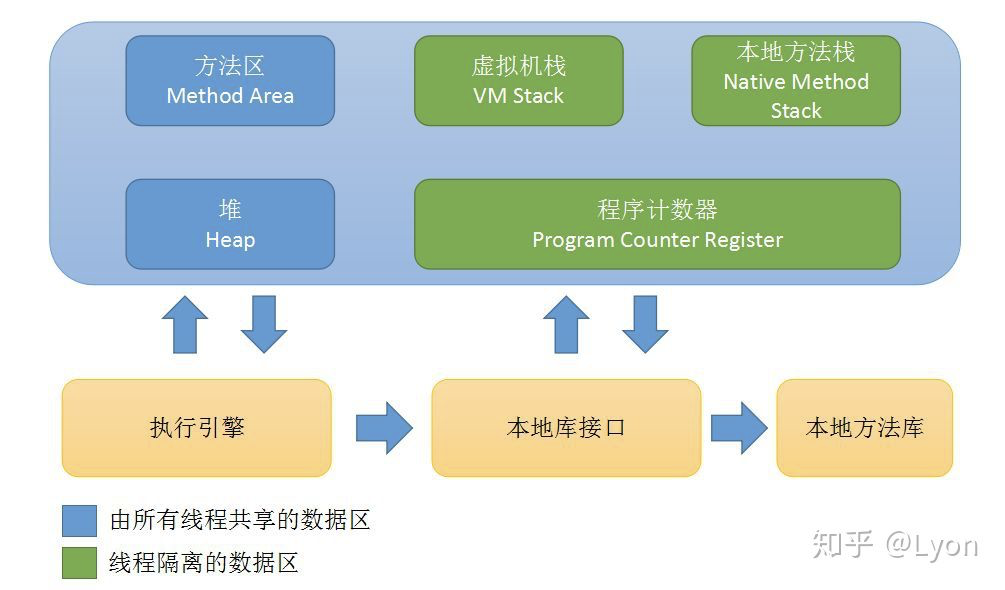
本篇文章主要讲解Java(JVM)在运行期间,其运行时数据区域的作用、职责与划分。包括堆内存、栈内存——虚拟机栈、本地方法栈、方法区、常量池、程序计数器等概念。

采集可以使用JavaMXBean(采集文档参考 -- JMX获取jvm参数,cpu使用率,内存,线程,类等信息,实现一个简单的web版jvisualvm)

https://zhuanlan.zhihu.com/p/44694290
1. 程序计算器
Java虚拟机是可以多线程并发执行的。对于一个CPU任意时刻,只能执行JVM中的一条线程。这就意味着,JVM要想实现多线程,则每条线程必须有独立的程序计数器用来标记线程执行的指令的位置(线程切换后恢复到正确的执行位置)。所以——程序计数器是线程私有的,私有意味着各条线程之间的计数器互不影响。
程序计数器(Program Counter Register),是一块较小的内存空间,可以看作是当前线程所执行的字节码的行号指示器。在虚拟机的概念模型中字节码解释器的工作就是通过改变这个计数器的值来选取下一条需要执行的字节码指令,分支、循环、跳转、异常处理、线程恢复等基础功能都依赖于此计数器。JVM中的程序计数器也是在Java虚拟机规范中唯一一个没有规定任何OutOfMemoryError情况的区域。在任意时刻一个JVM线程只能执行一个方法的代码,方法可以是Java方法,或者是native方法。
此处还有2点需注意:
1.Java虚拟机中的程序计数器仅仅是虚拟机中的,存在于内存之上的“虚拟”计数器,而不是电脑中的实体程序计数器。
2.JVM线程中执行的方法有2种类型:普通Java方法和由其他语言实现的native方法。如果当前执行的是普通Java方法,则程序计数器记录的是虚拟机字节码指令的地址。如果当前执行的是native方法,则计数器的值为空(Undefined)。
2. Java方法栈(也称为 Java虚拟机栈(Java Virtual Machine Stacks))
Java方法栈和线程同时创建,用于存储栈帧。每个方法在执行时都会创建一个栈帧(Stack Frame),用于存储局部变量表、操作数栈、动态链接、方法出口等信息。每一个方法从调用直到执行完成的过程就对应着一个栈帧在虚拟机栈中从入栈到出栈的过程。
Java虚拟机规范中Java虚拟机栈内存的大小既可以被实现成固定大小,也可以根据计算动态拓展或收缩,当前大部分的JVM实现是支持动态拓展的。Java虚拟机栈可能发生的异常:
1.线程请求分配的栈容量>Java虚拟机最大栈容量,则JVM会抛出StackOverFlowError异常。(例子:方法递归调用时,Java方法栈不够用:https://blog.csdn.net/u011983531/article/details/79563162)
2.如果Java虚拟机可动态拓展,则如果在拓展的过程中无法申请到足够的内存,就会抛出OutOfMemoryError异常。
Java虚拟机—栈帧、操作数栈和局部变量表
https://zhuanlan.zhihu.com/p/45354152
关于「栈帧」,我们在看看《Java虚拟机规范》中的描述:
栈帧是用来存储数据和部分过程结果的数据结构,同时也用来处理动态连接、方法返回值和异常分派。
栈帧随着方法调用而创建,随着方法结束而销毁——无论方法正常完成还是异常完成都算作方法结束。
栈帧的存储空间由创建它的线程分配在Java虚拟机栈之中,每一个栈帧都有自己的本地变量表(局部变量表)、操作数栈和指向当前方法所属的类的运行时常量池的引用。
接下来,详细讲解一下栈帧中的局部变量表、操作数栈、动态连接、方法返回地址等各个部分的数据结构和作用。
2.1 局部变量表
局部变量表(Local Variable Table)是一组变量值存储空间,用于存放方法参数和方法内定义的局部变量。
returnAddress类型的数据。reference类型表示对一个对象实例的引用。returnAddress类型是为jsr、jsr_w和ret指令服务的,目前已经很少使用了。
2.2 操作数栈
操作数栈(Operand Stack)也常称为操作栈,它是一个后入先出栈(LIFO)。同局部变量表一样,操作数栈的最大深度也在编译的时候写入到方法的Code属性的max_stacks数据项中。
当一个方法刚刚开始执行时,其操作数栈是空的,随着方法执行和字节码指令的执行,会从局部变量表或对象实例的字段中复制常量或变量写入到操作数栈,再随着计算的进行将栈中元素出栈到局部变量表或者返回给方法调用者,也就是出栈/入栈操作。一个完整的方法执行期间往往包含多个这样出栈/入栈的过程。
2.3 动态连接
在一个class文件中,一个方法要调用其他方法,需要将这些方法的符号引用转化为其在内存地址中的直接引用,而符号引用存在于方法区中的运行时常量池。
Java虚拟机栈中,每个栈帧都包含一个指向运行时常量池中该栈所属方法的符号引用,持有这个引用的目的是为了支持方法调用过程中的动态连接(Dynamic Linking)。
这些符号引用一部分会在类加载阶段或者第一次使用时就直接转化为直接引用,这类转化称为静态解析。另一部分将在每次运行期间转化为直接引用,这类转化称为动态连接。
2.4 方法返回
当一个方法开始执行时,可能有两种方式退出该方法:
正常完成出口
异常完成出口
一般来说,方法正常退出时,调用者的PC计数值可以作为返回地址,栈帧中可能保存此计数值。而方法异常退出时,返回地址是通过异常处理器表确定的,栈帧中一般不会保存此部分信息。
2.5 附加信息
虚拟机规范允许具体的虚拟机实现增加一些规范中没有描述的信息到栈帧之中,例如和调试相关的信息,这部分信息完全取决于不同的虚拟机实现。在实际开发中,一般会把动态连接,方法返回地址与其他附加信息一起归为一类,称为栈帧信息。
test2()方法中的字节码执行过程
如上,代码中序号0的指令——0: iinc对应test2源码中try块中:b += 20。此处test2()方法是在主函数main()中被调用的,在main()方法栈帧中操作数出栈一个int型值10,作为test2()方法调用的参数。test2()方法调用时,会新构建test2方法的栈帧(从而成为当前栈帧),10作为参数就存到了当前栈帧的局部变量表0号位置。所以在0: iinc 0, 20执行时,test2()方法栈帧中局部变量表0号位置已经是有了10这个值的。然后,指令一行行地执行过程如上述注释↑。
这种栈帧有两个主要的组成部分,分别是局部变量区,以及字节码的操作数栈。这里的局部变量是广义的,除了普遍意义下的局部变量之外,它还包含实例方法的“this 指针”以及方法所接收的参数。
在 Java 虚拟机规范中,局部变量区等价于一个数组,并且可以用正整数来索引。除了 long、double 值需要用两个数组单元来存储之外,其他基本类型以及引用类型的值均占用一个数组单元。
Java 虚拟机的算数运算几乎全部依赖于操作数栈。也就是说,我们需要将堆中的 boolean、byte、char 以及 short 加载到操作数栈上,而后将栈上的值当成 int 类型来运算。
对于 boolean、char 这两个无符号类型来说,加载伴随着零扩展。举个例子,char 的大小为两个字节。在加载时 char 的值会被复制到 int 类型的低二字节,而高二字节则会用 0 来填充。
3. 本地方法栈
native method stack
4. Java堆
前面所说的程序计数器、Java虚拟机栈、本地方法栈通常只占很小一部分的内存空间,对与大多数应用来说,Java堆(Java Heap)才是JVM管理的内存空间中最大的一块。此区域存在的唯一目的就是存放对象实例,几乎所有的对象实例都会在这被分配内存,而且Java堆是被所有线程共享的一块内存区域。
Java堆是Java中垃圾收集器管理的主要区域,因此也被称为GC堆—Garbage Collected Heap.
关于垃圾堆的问题O不,GC堆的问题,我们以后会经常见到,著名的垃圾回收算法我们也会再之后的文章中详细探讨。
(根据Java虚拟机规范的规定,Java堆可以处于物理上不连续的内存之中,只要逻辑上是连续的即可。且和栈一样,不同的JVM实现可以有不同的内存分配策略,Java堆的内存既可以设计成固定大小,也可以是可动态拓展的。)
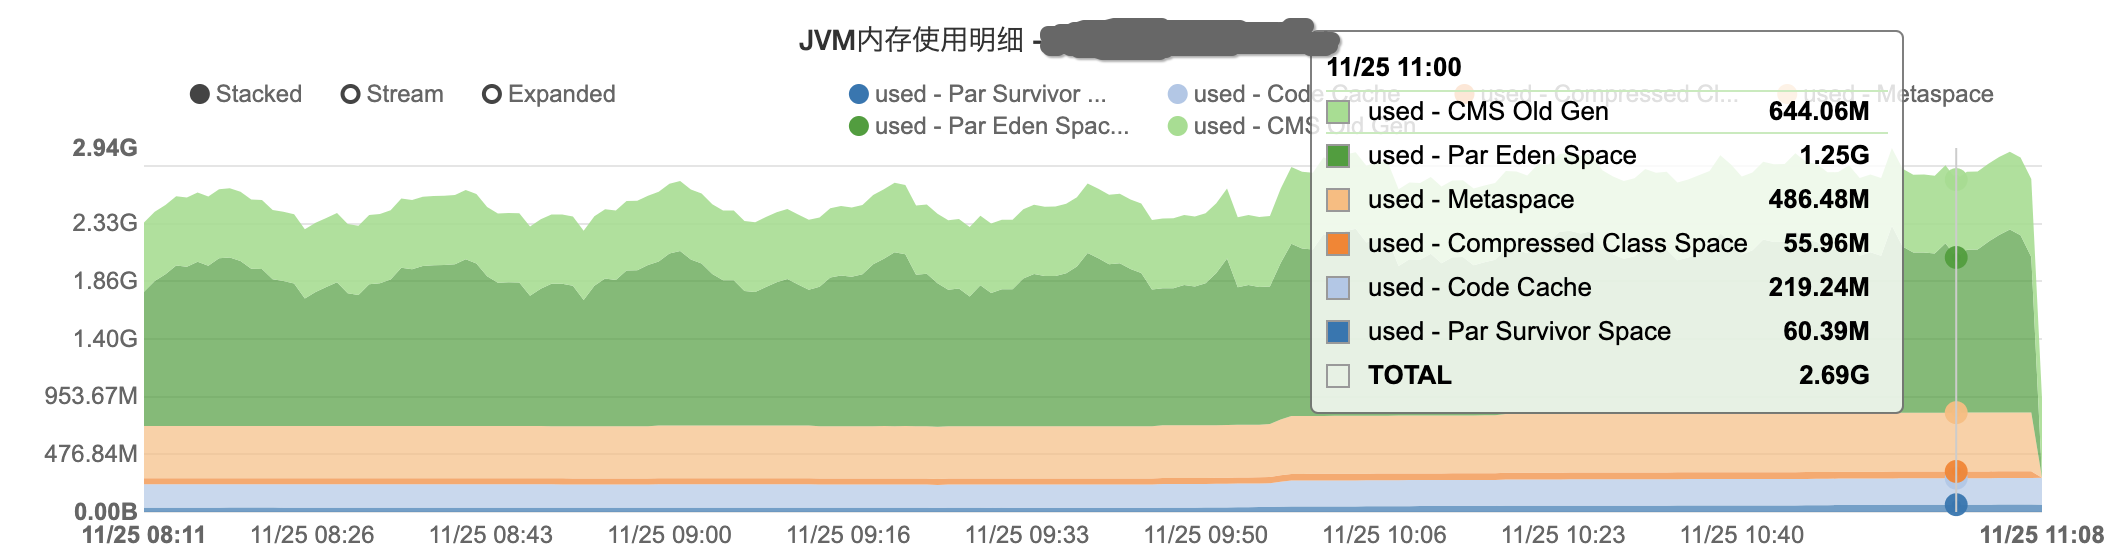
1) Par Eden Space : Most new java objects are created in Par Eden Space. Once this heap area is exhausted(耗尽), JVM initiates a stop the world garbage collection (GC) in the Eden space. At this point, based on the GC algorithm, jvm will clean all unreachable objects and will recover memory in young gen. But there would be reachable objects and these objects will be moved over to Survivor Space.
2) Par Survivor Space : As reachable objects are moved to Survivor space, at some point this survivor space would also get filled. When this space gets filled, and in some case even where this space is not full, GC would run in this region, cleaning up memory for unreachable objects and reachable objects will be moved to CMS Old Gen on Heap. This is another stop the world GC.
3) CMS Old Gen : Any objects surviving the GC in par Survivor space will be move to the old gen. This is the heap area meant for permanent objects. Ideally(理想情况下) a GC should never run in this region. So, you need to decide on the size of this region on the basis of the memory occupied by your permanent objects. And also the size of Par Eden and Survivor space should be such that temporary objects do not end up in this region(Par Eden and Survivor 的空间大小应确保临时对象不会出现在 CMS Old gen).
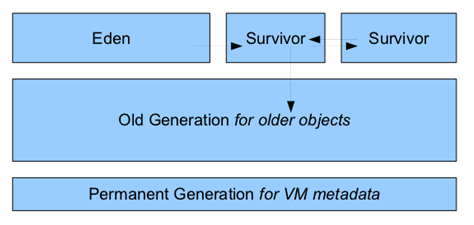
(图为1.7之前的内存布局,在java8之后,移除了方法区permanent generation)。
Java 虚拟机将堆划分为新生代和老年代。其中,新生代又被划分为 Eden 区,以及两个大小相同的 Survivor 区,其中一个 Survivor 区会一直为空。

5. 方法区(MetaSpace)
参考:https://stuefe.de/posts/metaspace/what-is-compressed-class-space/,译文查看
方法区(Method Area),与Java堆一样是各个线程共享的内存区域。用于存储被JVM加载的类信息、常量、静态变量、即时编译器编译后的代码等数据。虽然Java虚拟机规范将方法区描述为堆的一个逻辑部分,但是它却有个别名叫做Non-Heap(非堆),目的就是和Java堆区分开来。
Java虚拟机规范对方法区的限制十分宽松,除了和Java堆一样不需要连续的内存空间分配和可选择固定大小或可拓展内存以外,方法区也可以被垃圾回收器管理或不受其管理。
首先,要明确一个「概念」——方法区,是一个概念,是Java虚拟机规范中定义的概念,一个「非堆」的运行时数据区域,用于存放被JVM加载的类信息、常量、静态变量、即时编译器编译后的代码等数据,运行时常量池也是存放于方法区中。逻辑上的「非堆」表示和Java堆独立,那物理上呢?Java虚拟机规范中定义了方法区这个概念,但是并没有规定此区域的是否需要垃圾收集。
在Java7以前,HotSpot虚拟机中,方法区也被称为“永久代”,因为在物理上,方法区使用的是由JVM开辟的堆内存,由于和Java堆共享内存且内存空间由垃圾收集器统一分配和管理,自然的垃圾收集也拓展到了方法区上。此时,Java堆中分区为青年代Young Generation和老年代Old Generation,而方法区自然地被称为永久代Permanent Generation 。
(JVM虚拟机有不同的实现,比较主流的是sun公司的HotSpot虚拟机,在此才有“永久代的概念”,其他虚拟机不存在“永久代”这个概念)
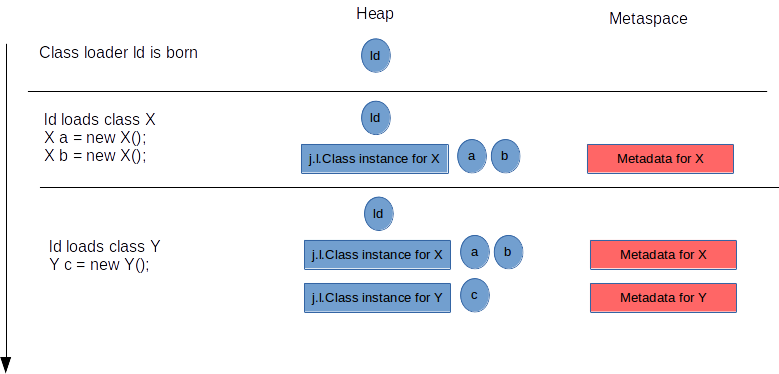
在Java8中,HotSpot虚拟机改变了原有方法区的物理实现,将原本由JVM管理内存的方法区的内存移到了虚拟机以外的计算机本地内存,并将其称为元空间(Metaspace)。这样一来,现在的方法区实际存储在于元空间,再也不用和Java堆共享内存了,“永久代”也就永久地被撤销了。
尽管永久代撤销了,方法区这个逻辑上的空间一直是存在的,所以在java8以后,方法区的垃圾回收在物理上就是对元空间的垃圾回收。由于元空间用的是计算机本地内存,所以理论上来说只要内存足够大,方法区就能有多大,实际上Metaspace的大小是可以通过参数设定的,如果Metaspace的空间占用达到了设定的最大值,那么就会触发GC来收集死亡对象和类的加载器。常用的G1和CMS垃圾收集器都能很好地回收Metaspace区。
- 分类:
- Klass Metaspace:用来存klass的,klass是我们熟知的class文件在jvm里的运行时数据结构
- NoKlass Metaspace:专门来存klass相关的其他的内容,比如method,constantPool等等
- 何时分配MetaSpace?:
-
When a class is loaded and its runtime representation in the JVM is being prepared, Metaspace is allocated by its class loader to store the class’ metadata.
-
- 何时回收MetaSpace?:
-
The allocated Metaspace for a class is owned by its class loader 1. It is only released when that class loader itself is unloaded, not before.
That in turn happens only after all classes loaded by this loader have no live instances anymore, and there are no references to these classes and its class loader, and a GC did run (see: JLS 12.7. Unloading of Classes and Interfaces).

-
5.1 Klass Metaspace->Compressed Class Cache
在 64 位平台上,HotSpot 使用了两个压缩优化技术,Compressed Object Pointers (“CompressedOops”--这里暂不讨论) 和 Compressed Class Pointers。
压缩指针,指的是在 64 位的机器上,使用 32 位的指针来访问数据(堆中的对象或 Metaspace 中的元数据)的一种方式。
这样有很多的好处,比如 32 位的指针占用更小的内存,可以更好地使用缓存,在有些平台,还可以使用到更多的寄存器。
当然,在 64 位的机器中,最终还是需要一个 64 位的地址来访问数据的,所以这个 32 位的值是相对于一个基准地址的值。
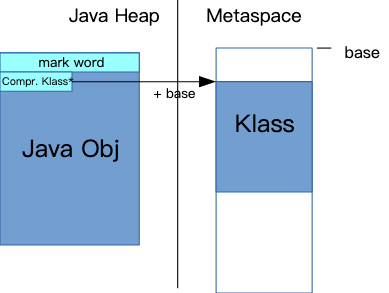
每个 Java 对象,在它的头部,有一个引用指向 Metaspace 中的 Klass 结构。

当使用了 compressed class pointers,这个引用是 32 位的值,为了找到真正的 64 位地址,需要加上一个 base 值:
为了复用已有的 Metaspace 空间,使用了一个小技巧:
在 Class Space 和 Non-Class Space 中,分别都有 VirtualSpaceList 和 ChunkManager 两个结构。
但是对于 Class Space,既然我们需要一个连续的空间我们不能使用一个链表来存放所有的 Node,所以这个链表退化为只有一个节点,并且不能扩展。这个 Node 就是 compressed class space,和 Non-Class Space 中的 Node 相比,它可是巨大无比。

5.2 运行时常量池(NoKlass Space中的一部分)
运行时常量池(Runtime Constant Pool)是.class文件中每一个类或接口的常量池表(constant pool table)的运行时表示形式,属于方法区的一部分。每一个运行时常量池都在Java虚拟机的方法区中分配,在加载类和接口到虚拟机后,就创建对应的运行时常量池。常量池的作用是:
存放编译器生成的各种字面量和符号引用。当虚拟机运行时,需要从常量池获得对应的符号引用,再在类创建或运行时解析、翻译到具体的内存地址之中。
字面量(Literal),通俗理解就是Java中的常量,如文本字符串、声明为final的常量值等。
符号引用(Symbolic References)则是属于编译原理中的概念,包括了下面三类常量:
1.类和接口的全限定名
2.字段的名称和描述符
3.方法的名称和描述符
JVM基础 -- 基本类型
http://zhongmingmao.me/2018/12/15/jvm-basic-native-type/
public class Foo{
public static void main(String[] args) {
boolean flag = true;
if (flag) System.out.println("Hello, Java!");
if (flag == true) System.out.println("Hello, JVM!");
}
}
- ifeq succeeds if and only if value = 0
- 翻译成人话就是说,如果局部变量“flag”的值为 0,那么跳过打印“Hello, Java!”的语句。
- if_icmpne succeeds if and only if value1 ≠ value2
- 如果局部变量的值和整数 1 不相等,那么跳过打印“Hello, JVM!”的语句
- 文档:https://docs.oracle.com/javase/specs/jvms/se11/html/jvms-6.html#jvms-6.5.iconst_i
Java 的基本类型除了上面提到的 boolean 类型外,Java 的基本类型还包括整数类型 byte、short、char、int 和 long,以及浮点类型 float 和 double。
Java 的基本类型都有对应的值域和默认值。可以看到,byte、short、int、long、float 以及 double 的值域依次扩大,而且前面的值域被后面的值域所包含。因此,从前面的基本类型转换至后面的基本类型,无需强制转换。另外一点值得注意的是,尽管他们的默认值看起来不一样,但在内存中都是 0。
6. Code Cache
(查看)
在Java中提到“编译”,自然很容易想到 javac 编译器将.java文件编译成为.class文件的过程,这里的 javac 编译器称为前端编译器,其他的前端编译器还有诸如Eclipse,JDT中的增量式编译器ECJ等。相对应的还有 后端编译器,它在程序运行期间将字节码转变成机器码(现在的Java程序在运行时基本都是 解释执行加编译执行),如HotSpot虚拟机自带的JIT(Just In Time Compiler)编译器(分Client端和Server端)。
Java程序最初是仅仅通过解释器解释执行的,即对字节码逐条解释执行,这种方式的执行速度相对会比较慢,尤其当某个方法或代码块运行的特别频繁时,这种方式的执行效率就显得很低。于是后来 在虚拟机中引入了JIT编译器(即时编译器),当虚拟机发现某个方法或代码块运行特别频繁时,达到某个阈值,就会把这些代码认定为“Hot Spot Code”(热点代码),为了提高热点代码的执行效率,在运行时,虚拟机将会把这些代码编译成与本地平台相关的机器码,并进行各层次的优化,完成这项任务的正是JIT编译器。
现在主流的商用虚拟机(如:Sun HotSpot、IBM J9)中几乎 都同时包含解释器和编译器,三大商用虚拟机之一的JRockit是个例外,它内部没有解释器,因此会有启动相应时间长之类的缺点,但它主要是面向服务端的应用,这类应用一般不会重点关注启动时间。
解释器与编辑器二者各有优势:
- 当程序需要迅速启动和执行时,解释器可以首先发挥作用,省去编译的时间,立即执行;
- 当程序运行后,随着时间的推移,编译器逐渐会发挥作用,把越来越多的代码编译成本地代码后,可以获取更高的执行效率;
- 解释执行可以节约内存,而编译执行可以提升效率;
运行过程中会被即时编译器编译的“热点代码”有两类:
- 被多次调用的方法;
- 被多次调用的循环体;
7. Direct Memory
Java NIO中,关于DirectBuffer,HeapBuffer的疑问?
Java IO 学习(六)Java的Direct Memory与IO
Java NIO中的direct buffer(主要是DirectByteBuffer)其实是分两部分的:
       Java        |      native
                   |
 DirectByteBuffer  |     malloc'd
 [    address   ] -+-> [   data    ]
                   |
其中 DirectByteBuffer 自身是一个Java对象,在Java堆中;而这个对象中有个long类型字段address,记录着一块调用 malloc() 申请到的native memory。
8. 附录:JVM performance tuning
英文博客JVM performance tuning
Objective: Java applications can run into performance issues if garbage collection is not tuned(调整) properly. You may have experienced that your JVM is not responding, its taking a lot of time for garbage collection or there are out of memory errors in your logs. If you are facing the same problems, then you would need to know on how to analyse heap dumps and on how to dive into deep heap dumps, thread dumps and much more.
Basics: Let understand some basics about JVM and simple techniques in its performance tuning(性能调优).
Firstly, its important to understand the structure of Java Heap Memory. Java heap is always divided into three major regions. The three regions are young, survivor and permanent generation.
You can analyse java heap by using tools like console or visual vm. Before your analysis you would need to understand heap regions and their purpose :-
1) Heap Memory Pool "Par Eden Space"
2) Heap Memory Pool "Par Survivor Space"
3) Heap Memory Pool "CMS Old Gen"
4) Non Heap Memory Pool "Metaspace"
5) Non Heap Memory Pool "Code Cache"
6) Non Heap Memory Pool "Compressed Class Cache"
Lets look at each heap/non heap memory division one by one.
1) Par Eden Space : Most new java objects are created in Par Eden Space. Once this heap area is exhausted(耗尽), JVM initiates a stop the world garbage collection (GC) in the Eden space. At this point, based on the GC algorithm, jvm will clean all unreachable objects and will recover memory in young gen. But there would be reachable objects and these objects will be moved over to Survivor Space.
2) Par Survivor Space : As reachable objects are moved to Survivor space, at some point this survivor space would also get filled. When this space gets filled, and in some case even where this space is not full, GC would run in this region, cleaning up memory for unreachable objects and reachable objects will be moved to CMS Old Gen on Heap. This is another stop the world GC.
3) CMS Old Gen : Any objects surviving the GC in par Survivor space will be move to the old gen. This is the heap area meant for permanent objects. Ideally(理想情况下) a GC should never run in this region. So, you need to decide on the size of this region on the basis of the memory occupied by your permanent objects. And also the size of Par Eden and Survivor space should be such that temporary objects do not end up in this region(Par Eden and Survivor 的空间大小应确保临时对象不会出现在 CMS Old gen).
(图为1.7之前的内存布局,在java8之后,移除了方法区permanent generation)。
6) Compressed Class Cache : Class Cache is another memory region. When you enable UseCompressedOops and/or UseCompressedClassPointers via JVM arguments, this still memory space starts filling up. It stores metaspace data but in a different way.
Now that we have a basic idea on the memory spaces in JVM, we can look at the performance tuning basics one by one. They are as follows:-
1) Young generation size and its ratio to Perm Gen : In an ideal scenario, when a young gen gc runs, then it recovers memory for all objects and a very few will be moved to survivor space. And once survivor space is full, a GC on survivor space should recover all temporary objects and only permanent objects should be moved to Perm gen. And If temporary objects are getting move to Perm Gen then, you may not be having a properly tuned GC. You would like to increase the size of young ten memory space. This is because in your case GC in Young and Survivor space is happening too quickly and as a result temporary objects are getting moved to Perm gen. A typical young gen to perm gen ratio is 1: 4. And to tune you to simulate appropriate load for your application. On the other hand, young gen space should not be very large as there will be longer pauses for GC on the same.
Also, Oracle's flight recorder is a very useful profiler.
More to follow soon...........
Questions :-
1) How can i monitor the memory performance of my JVM ?
Just tap into the the mbean java.lang.Memory.HeapMemoryUsage. You can monitor all performance metrics for JVM by tapping into jvm mbeans. Also, do consider pushing your own mbeans to make sure that the monitoring is robust.
2) Give me one major cause of high GC overheads in java applications ?
Object serialisation and deserialisation is one of the major causes of gc overhead. Java serialization and deserialization, by default has a performance overhead. A custom serializer like kyro serializer is recommended.
3) What is the size of a heap dump file?
A typical heap dump file size is around 1.5x of your heap size of JVM after full garbage collection.
4) Which tool should be used to analyze heap dumps?
Eclipse MAT is a very good option to analyse JVM heap dumps and generate deep heap profiles. Oracle's flight recorder is another option.
5) Does ObjectMapper in jackson create a lot of GC overhead ?
Yes ObjectMapper's convert method should be used as minimum as possible. Do not convert your stream of bytes to String and then to your POJO. The stream of bytes should be de-serialized directly to your POJO.
6) How do I benchmark my code ?
Yes. For an important piece of code, we should benchmark in the unit testing phase itself. I have noted down the best benchmarking techniques by unit testing in the below link.
benchmark-your-code.html
Other Links:
sparkInsides.html
GC Tuning