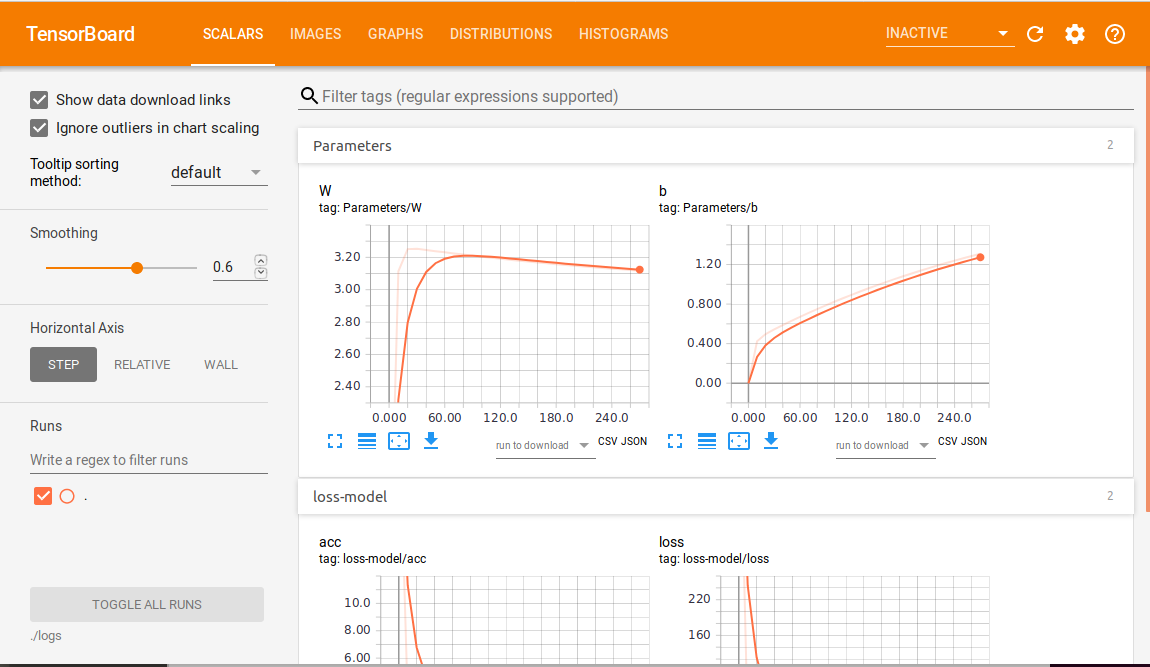
tf.summary + tensorboard 用来把graph图中的相关信息,如结构图、学习率、准确率、Loss等数据,写入到本地硬盘,并通过浏览器可视化之。
整理的代码如下:
import tensorflow as tf

x_train = [1, 2, 3, 6, 8]
y_train = [4.8, 8.5, 10.4, 21.0, 25.3]

x = tf.placeholder(tf.float32, name='x')
y = tf.placeholder(tf.float32, name='y')

W = tf.Variable(1, dtype=tf.float32, name='W')
b = tf.Variable(0, dtype=tf.float32, name='b')

linear_model = W * x + b

with tf.name_scope("loss-model"):
    loss = tf.reduce_sum(tf.square(linear_model - y))
    acc = tf.sqrt(loss)
    tf.summary.scalar("loss", loss)
    tf.summary.scalar("acc", acc)

with tf.name_scope("Parameters"):
    tf.summary.scalar("W", W)
    tf.summary.scalar("b", b)

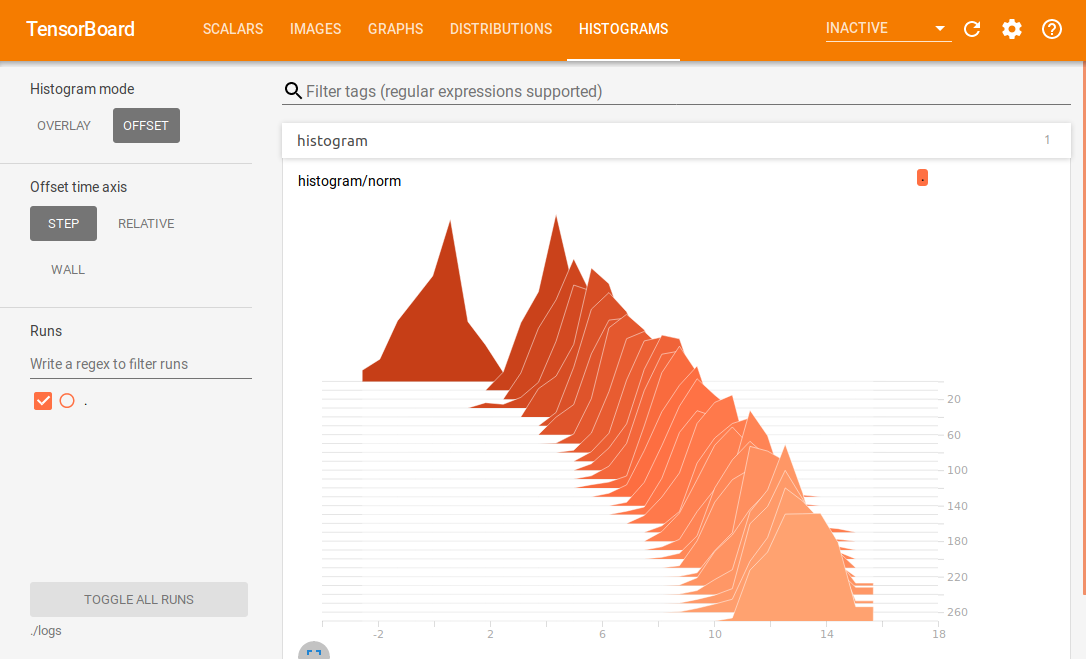
tf.summary.histogram('histogram/norm', tf.random_normal(shape=[100], mean=10*b, stddev=1),)
tf.summary.image("image", tf.random_uniform([6,10,10,3]), max_outputs=10)

train_step = tf.train.GradientDescentOptimizer(0.001).minimize(loss)

sess = tf.Session()
sess.run(tf.global_variables_initializer())

# 收集所有的操作数据
merged = tf.summary.merge_all()

# 创建writer对象
writer = tf.summary.FileWriter('./logs', sess.graph)

# 训练
for i in range(300):
    summary, _ = sess.run([merged, train_step], {x: x_train, y: y_train})
    if i%10 == 0:
        writer.add_summary(summary, i)

curr_W, curr_b, curr_loss, curr_acc = sess.run([W, b, loss, acc], {x: x_train, y: y_train})
print("After train W: %f, b: %f, loss: %f, acc: %f" % (curr_W, curr_b, curr_loss, curr_acc))
运行结束后,可以看到logs文件夹如下所示:

在当前目录,运行tensorboard --logdir=./logs --port 6006,浏览器打开,得到如下页面


其中,颜色越深的切片越老,颜色越浅的切片越新。
参考:
https://www.jianshu.com/p/0ad3761e3614
https://blog.csdn.net/akadiao/article/details/79551180
https://blog.csdn.net/dcrmg/article/details/79810142