原文地址:https://www.cnblogs.com/wift/p/11064545.html
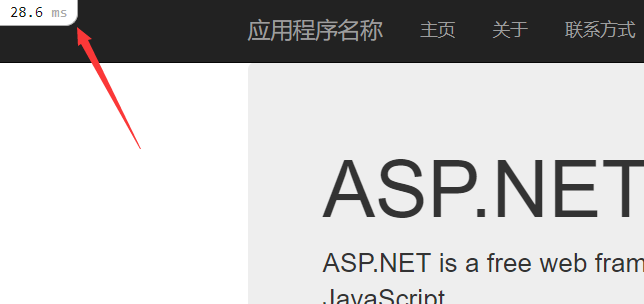
想要通过在MVC中view中直观的查看页面加载以及后台EF执行情况,可以通过MiniProfiler小工具来实现。
但是从网上搜索的相关信息要么是MVC4下的老版本的MiniProfiler,要么就是标题是MVC5+EF6但是里讲的根本实现不了结果。
经过我自己一番折腾后,终于成功搞定。
具体操作分为三步:
ps:没图说个毛啊。
上图:
现在将具体的操作步骤记录一下,方便以后用到。
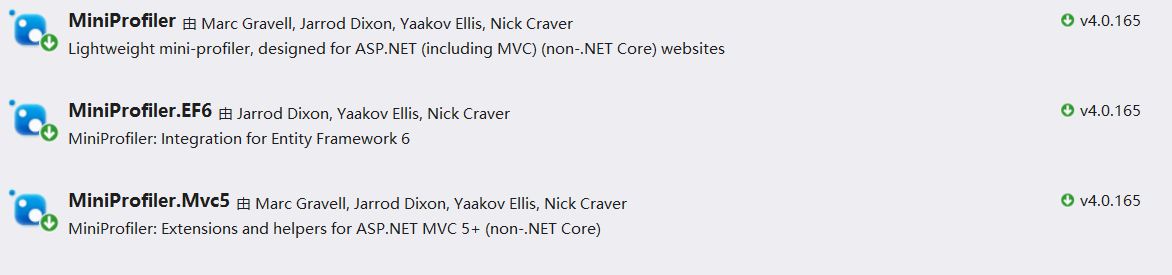
1、安装MiniProfiler.EF6
写在前面:
1、需要在vs中添加MiniProfiler、MiniProfiler.EF6、MiniProfiler.MVC5三个包
2、引用的三个包版本MiniProfiler 4.0.165, MiniProfiler.EF6 4.0.165 ,MiniProfiler.MVC5 4.0.165
引用情况如下:
2、将MiniProfiler.EF配置到项目中
1、配置Global.asax文件
打开Global.asax文件,在Application_Start、 Application_BeginRequest、Application_EndRequest方法中添加MiniProfiler的配置:
        protected void Application_Start()
        {
            AreaRegistration.RegisterAllAreas();
            FilterConfig.RegisterGlobalFilters(GlobalFilters.Filters);
            RouteConfig.RegisterRoutes(RouteTable.Routes);
            BundleConfig.RegisterBundles(BundleTable.Bundles);

            MiniProfiler.Configure(new MiniProfilerOptions());
            MiniProfilerEF6.Initialize();
        }


        protected void Application_BeginRequest()
        {
            if (Request.IsLocal)
            {
                MiniProfiler.StartNew();

            }

        }
        protected void Application_EndRequest()
        {
            MiniProfiler.Current?.Stop();
        }
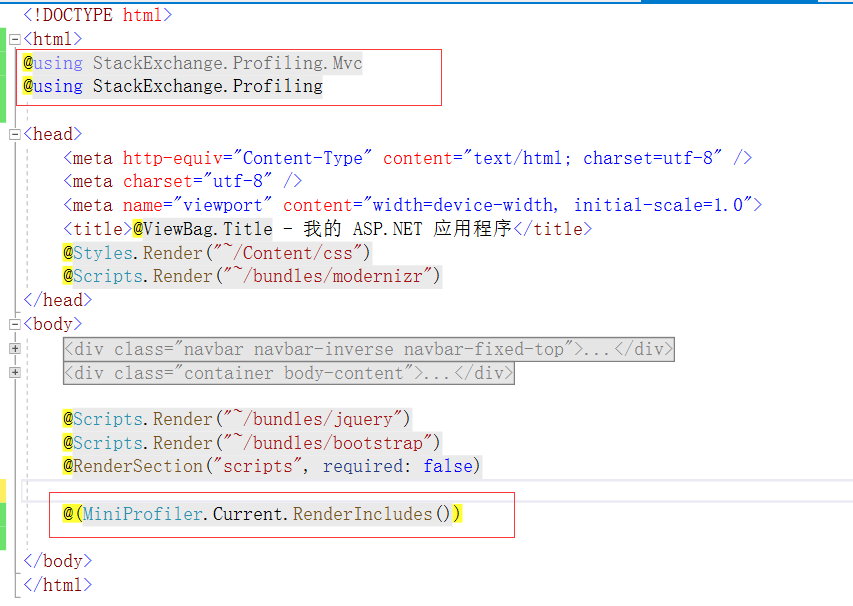
2、修改_Layout.cshtml布局文件
首页在ViewsShared\_Layout.cshtml页面中引入两个文件
@using StackExchange.Profiling.Mvc
@using StackExchange.Profiling
然后在<body>标签最后添加一行代码:
@(MiniProfiler.Current.RenderIncludes())
配置好后的页面如下:
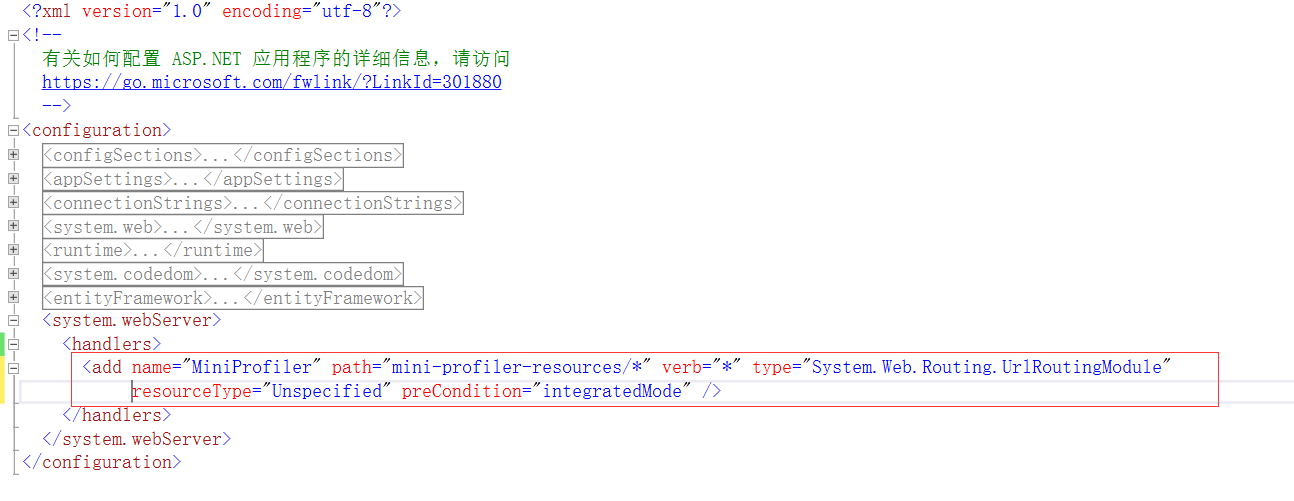
3、修改Web.config
在Web.config中
  <system.webServer>
    <handlers>
      <add name="MiniProfiler" path="mini-profiler-resources/*" verb="*" type="System.Web.Routing.UrlRoutingModule" resourceType="Unspecified" preCondition="integratedMode" />
    </handlers>
  </system.webServer>
要在页面上显示MVC和EF的调试跟踪时间必须要加入上面的代码
配置图如下:
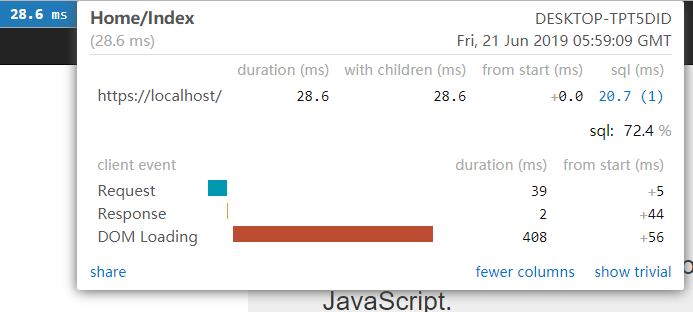
3、运行结果

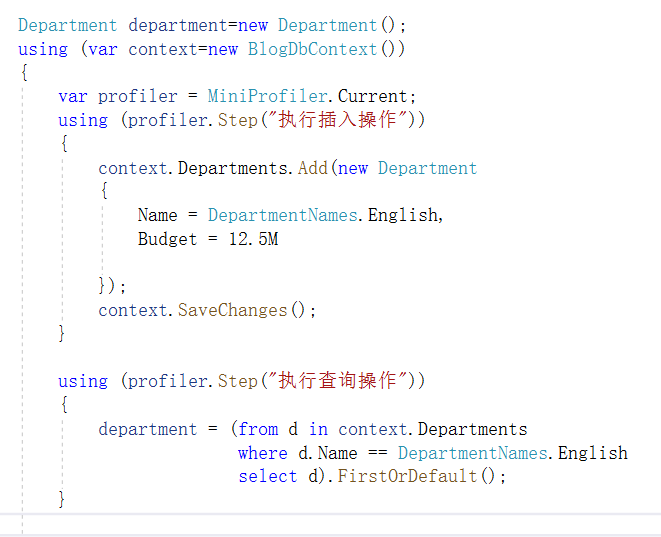
4、具体方法执行性能监控
如果需要监控具体的一个操作的性能,可以通过添加如下代码实现:

只需要将想要监控的操作放到//Todo中就可以了。
本地测试代码配置如下:
展示一下执行效果
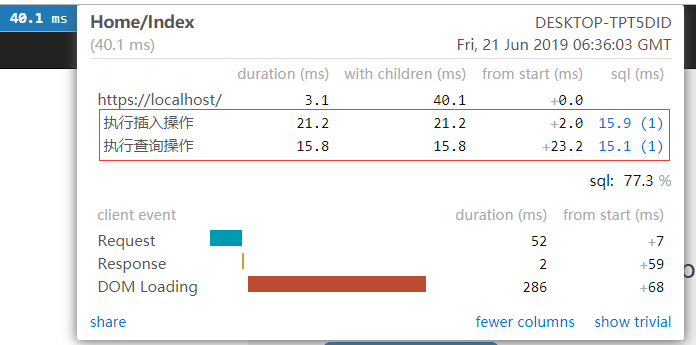
上面多出了刚才后台配置的“执行插入操作”,“执行查询操作”两个操作的记录。这样就可以细致的监控到咱们想要监控的内部具体操作情况了。
可以方便我们及时、快速、方便的找出代码的性能瓶颈所在。
PS:如果有描述的不对的,请各位不吝赐教,我好及时修改,以免给其他看到的人造成错误示范
谢谢