vue是一个很好用的前端框架,前端只管处理数据,其他的都不用操心。
使用vue来做后台管理应用是不错的选择。
一:创建vue项目,引入Ant Design Vue组件库
官方文档:
- 安装和初始化
$ npm install -g @vue/cli
# OR
$ yarn global add @vue/cli
2. 创建项目
vue create antd-demo
3.安装 &引入 UI库
# npm i ant-design-vue
# OR
# yarn add ant-design-vue
4. main.js (添加以下代码)
import Antd from 'ant-design-vue'
import 'ant-design-vue/dist/antd.css';

Vue.use(Antd);
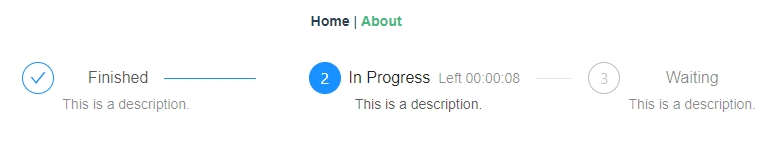
现在在页面中已经可以使用antd的组件了~
举个栗子,复制了一下步骤条的demo,效果如下:
5. 写代码过程中,如果觉得 EsLInt 比较麻烦,可以手动关闭
// vue.congig.js
module.exports = {
    lintOnSave: false
}
二、使用AntV的G2Plot组件库
官方文档:
1. 安装UI组件库
npm install @antv/g2plot --save
2. 在需要使用图表的页面中import该组件,然后就可以使用了
举个栗子,复制了一下折线图的demo,效果如下:

三、使用Echarts组件库
官方文档:
1.安装Echarts依赖
npm install echarts --save
2. 在需要使用到该组件的页面上引入组件
import echarts from "echarts";
require("echarts/lib/chart/bar"); // 引入柱状图
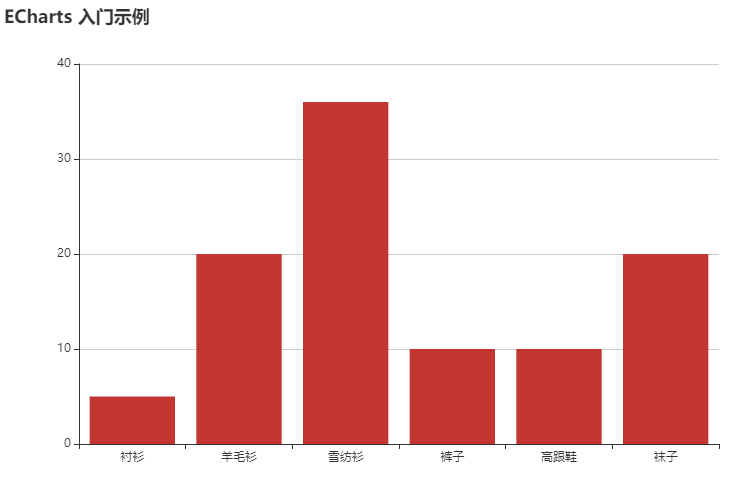
举个栗子,复制了一下柱状图的demo,效果如下:
文中的demo代码:
<template>
  <div>
    <div class="box">
      <p>Ant Design Vue</p>
      <a-steps :current="1">
        <a-step>
          <template slot="title">Finished</template>
          <span slot="description">This is a description.</span>
        </a-step>
        <a-step title="In Progress" sub-title="Left 00:00:08" description="This is a description." />
        <a-step title="Waiting" description="This is a description." />
      </a-steps>
    </div>

    <div class="box">
      <p>AntV —— G2Plot</p>
      <div class="box1" id="canvas"></div>
    </div>

    <div class="box">
      <p>Echarts</p>
      <div class="box1" id="canvas2"></div>
    </div>
  </div>
</template>

<script>
import { Line } from "@antv/g2plot";
import echarts from "echarts";
require("echarts/lib/chart/bar");
export default {
  data() {
    return {
      data: [
        { year: "1991", value: 3 },
        { year: "1992", value: 4 },
        { year: "1993", value: 3.5 },
        { year: "1994", value: 5 },
        { year: "1995", value: 4.9 },
        { year: "1996", value: 6 },
        { year: "1997", value: 7 },
        { year: "1998", value: 9 },
        { year: "1999", value: 13 },
      ],
    };
  },

  props: {},

  components: {},

  created() {},

  computed: {},

  mounted() {
    // G2Plot 折线图初始化
    this.linePlot = new Line("canvas", {
      data: this.data,
      xField: "year",
      yField: "value",
    });

    this.linePlot.render();

    // Echarts 初始化
    this.myChart = echarts.init(document.getElementById("canvas2"));
    this.option = {
      title: {
        text: "ECharts 入门示例",
      },
      tooltip: {},
      xAxis: {
        data: ["衬衫", "羊毛衫", "雪纺衫", "裤子", "高跟鞋", "袜子"],
      },
      yAxis: {},
      series: [
        {
          name: "销量",
          type: "bar",
          data: [5, 20, 36, 10, 10, 20],
        },
      ],
    };
    this.myChart.setOption(this.option);
  },

  methods: {},
};
</script>
<style>
.box {
  margin: 20px auto;
   800px;
  border: 1pxs solid gray;
  border-radius: 25px;
  box-shadow: 0 0 10px gray;
}
.box1 {
  margin: 0 auto;
   800px;
  height: 500px;
}
</style>
第四篇随笔。