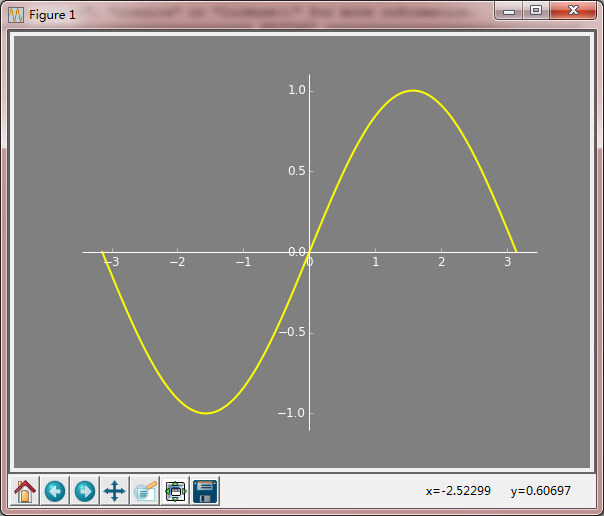
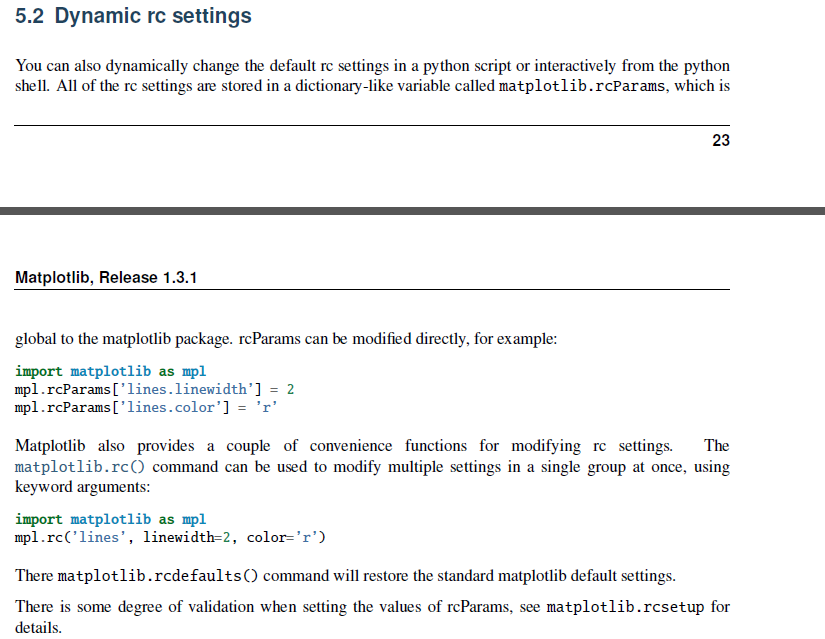
plot sin 动态配置rc settings
- 坐标轴颜色
- 线的颜色
- 绘图前景色
Code
#!/usr/bin/env python
# -*- coding: utf-8 -*-
import numpy as np
import matplotlib
import matplotlib.pyplot as plt

# Data to be represented
X = np.linspace(-np.pi,+np.pi,256)
Y = np.sin(X)

# Configuration via RC
matplotlib.rc('axes', facecolor = 'grey')
matplotlib.rc('axes', edgecolor = 'white')
matplotlib.rc('xtick', color = 'white')
matplotlib.rc('ytick', color = 'white')
matplotlib.rc('figure', facecolor = 'grey')
matplotlib.rc('savefig', facecolor = 'grey')

# Actual plotting
fig = plt.figure(figsize=(8,6), dpi=72)
axes = plt.subplot(111)
axes.plot(X,Y, color = 'yellow', linewidth=2, linestyle="-")
axes.set_xlim(1.1*X.min(), 1.1*X.max())
axes.set_ylim(1.1*Y.min(), 1.1*Y.max())

axes.spines['bottom'].set_position(('data',0))
axes.xaxis.set_ticks_position('bottom')
axes.spines['left'].set_position(('data',0))
axes.yaxis.set_ticks_position('left')
axes.spines['top'].set_color('none')
axes.spines['right'].set_color('none')

plt.show()
Keypoints
matplotlib.rc('axes', facecolor = 'grey')
Result