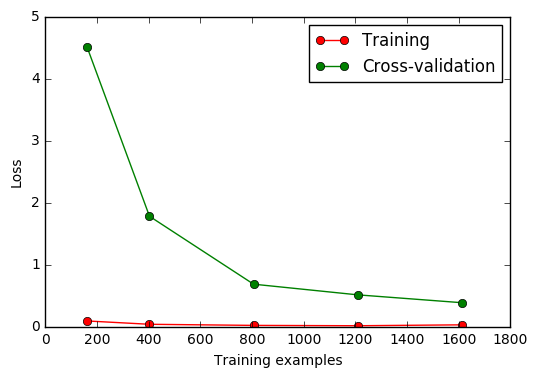
learning curve 可以很直观的看出我们的 model 学习的进度, 对比发现有没有 overfitting 的问题. 然后我们可以对我们的 model 进行调整, 克服 overfitting 的问题.
#!/usr/bin/env python2
# -*- coding: utf-8 -*-
from sklearn.model_selection import learning_curve
from sklearn.datasets import load_digits
from sklearn.svm import SVC
import matplotlib.pyplot as plt
import numpy as np

#加载digits数据集,其包含的是手写体的数字,从0到9。
# 数据集总共有1797个样本,每个样本由64个特征组成,
# 分别为其手写体对应的8×8像素表示,每个特征取值0~16。
digits = load_digits()
X = digits.data
y = digits.target

print X[:1,:]
"""
[[  0.   0.   5.  13.   9.   1.   0.   0.   0.   0.  13.  15.  10.  15.
    5.   0.   0.   3.  15.   2.   0.  11.   8.   0.   0.   4.  12.   0.
    0.   8.   8.   0.   0.   5.   8.   0.   0.   9.   8.   0.   0.   4.
   11.   0.   1.  12.   7.   0.   0.   2.  14.   5.  10.  12.   0.   0.
    0.   0.   6.  13.  10.   0.   0.   0.]]
"""
print y
"""
[0 1 2 ..., 8 9 8]
"""
train_sizes, train_loss, test_loss = learning_curve(SVC(gamma=0.001), X, y, cv=10,
               scoring='neg_mean_squared_error',
               train_sizes=[0.1, 0.25, 0.5, 0.75, 1])

print train_sizes
"""
[ 161  403  806 1209 1612]
"""
#平均每一轮所得平均方差(共5轮, 分别为样本的10%、25%、50%、75%、100%)
train_loss_mean = -np.mean(train_loss,axis=1)
test_loss_mean = -np.mean(test_loss,axis=1)

plt.plot(train_sizes, test_loss_mean, 'o-',color="r",label="Training")
plt.plot(train_sizes, test_loss_mean, 'o-', color="g",label="Cross-validation")

plt.xlabel("Training examples")
plt.ylabel("Loss")
plt.legend(loc="best")
plt.show()