本文由博主(SunboyL)原创,转载请注明出处:http://www.cnblogs.com/xsln/p/BeginProfiler.html
简介
在使用Profiler定位代码的性能热点时,很多同学往往忽略Profiler的提供接口,当发现某个Update函数特别耗时时,没有有效的手段进一步定位热点出自该Update函数的哪一个模块或哪一段代码。
使用Profiler评估客户端性能时,推荐使用Profiler提供的性能采样接口,来更精确地分析定位客户端存在的性能问题。
举个例子说明精确定位的优势:
测试源代码:


 1 using UnityEngine;
 2 using System.Collections;
 3 using System.Collections.Generic;
 4
 5 public class TestProfiler : MonoBehaviour {
 6     int t = 10000;
 7
 8     // 每帧Update都会进行校验和运行
 9     void Update () {
10         Check(t); // 校验
11         Run(); // 运行
12     }
13
14     void Check(int n) {
15         ProfilerSample.BeginSample("Check");
16         CheckA(); // 校验模块A
17
18         ProfilerSample.BeginSample("Calculate b");
19         // 数值运算
20         int b = n - 100;
21         if (b < 10)
22             b = 10;
23         ProfilerSample.EndSample();
24
25         CheckB(b); // 校验模块B
26         ProfilerSample.EndSample();
27     }
28
29     void CheckA() {
30         ProfilerSample.BeginSample("CheckA");
31         Debug.Log("校验模块A");
32         ProfilerSample.EndSample();
33     }
34
35     void CheckB(int loopCount) {
36         ProfilerSample.BeginSample("CheckB(loopCount={0})", loopCount);
37         Debug.Log("校验模块B");
38
39         ProfilerSample.BeginSample("new List<string>");
40         List<string> strList = new List<string>();
41         ProfilerSample.EndSample();
42
43         for (int i = 0; i < loopCount; ++i) {
44             ProfilerSample.BeginSample("Add str to list");
45             string str = string.Format("CheckB:{0}", i);
46             strList.Add(str);
47             ProfilerSample.EndSample();
48         }
49
50         Debug.Log(string.Format("list count: {0}", strList.Count));
51         ProfilerSample.EndSample();
52     }
53
54     void Run() {
55         ProfilerSample.BeginSample("Run");
56         Debug.Log("开始运行");
57         DoSomething();
58         ProfilerSample.EndSample();
59     }
60
61     void DoSomething() {
62     }
63
64     void OnGUI() {
65         GUILayout.BeginVertical();
66         if (GUILayout.Button("Enable/Disable ProfierSample.")) {
67             ProfilerSample.EnableProfilerSample = !ProfilerSample.EnableProfilerSample;
68         }
69
70         if (GUILayout.Button("Enable/Disable Profier sting format.")) {
71             ProfilerSample.EnableFormatStringOutput = !ProfilerSample.EnableFormatStringOutput;
72         }
73     }
74 }
关闭和开启Profiler性能采样接口的对比截图:
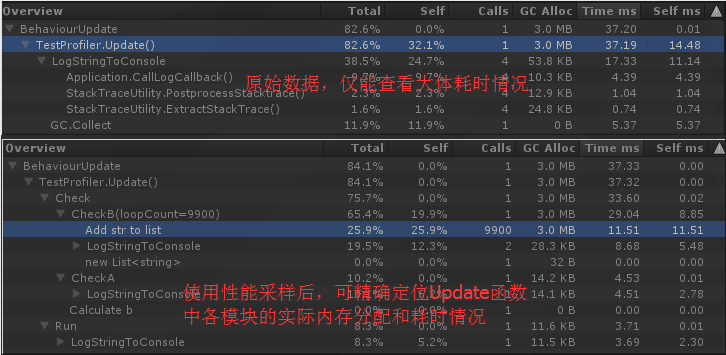
如上图,使用性能采样接口,可以精确发现该Update的耗时热点在Check函数下CheckB函数中,主要由List.Add()导致,被调用了9900次。
使用Profiler.BeginSample、Profiler.EndSample配对,可以有效定位用户自己编写的代码的性能热点。
除此之外,我封装了一套自己的接口,代码在本文最后面。之所以封装一层,原因如下:
1、提供Profiler性能采样开关,可随时关闭
2、提供字符串格式化功能,可在Profiler中显示自定义的文本,方便定位问题(使用时需要谨慎,后文叙述)
关于格式化字符串
有时候光知道热点代码位置是不够的,还需要知道代码中变量数据。
例如处理网络协议的OnRecv函数,该函数会根据不同的协议号调用不同的委托函数。此时,我们就可以在Profiler窗口中输出协议号、或者委托的具体函数名,以方便我们定位具体热点。

慎用格式化字符串
如果在Update函数中使用格式化输出,很有可能该Update函数每隔一段时间就会出现一次GC.Alloc。但这可能不是由于Update的实际操作导致,而是由于使用性能采样时的格式化输出导致的。
需要注意格式化字符串本身会带来内存分配开销,使用格式化字符串采样接口时需考虑自身对代码带来的影响。
使用经验:
1、在可能的热点函数上插入性能采样代码,建议编译手机版本来分析结果。当然,在熟悉代码的前提下,可以方便使用PC测试分析GC Alloc等问题。原因如下:
1)PC性能相对太好,一些手机上的瓶颈函数在PC上几乎不耗时,导致无法准确分析;
2)一些代码,特别是插件代码,PC和手机的执行流程不同,PC分析的结果不能准确表明手机也是同样结果。
2、在插入性能采样代码时,特别留意函数中是否存在多个return的现象。这些return如果没有处理好,就有可能导致性能采样的Begin和End不匹配,导致Profiler显示的结果有误。
3、对于协程函数,BeginSample、EndSample之间注意不能存在yeild return null,否则可能导致Unity客户端卡死、手机卡死等现象。个人分析:Begin和End配对分析的是单帧结果,出现yeild return null代表该区间将会分两帧甚至多帧完成。
封装好的性能采样接口代码(ProfilerSample.cs):
 1 using UnityEngine;
 2 using System;
 3
 4 public class ProfilerSample { // by SunboyL
 5     public static bool EnableProfilerSample = true;
 6     public static bool EnableFormatStringOutput = true;// 是否允许BeginSample的代码段名字使用格式化字符串(格式化字符串本身会带来内存开销)
 7
 8     public static void BeginSample(string name) {
 9 #if ENABLE_PROFILER
10         if (EnableProfilerSample){
11             Profiler.BeginSample(name);
12         }
13 #endif
14     }
15
16     public static void BeginSample(string formatName, params object[] args) {
17 #if ENABLE_PROFILER
18         if (EnableProfilerSample) {
19             // 必要时很有用,但string.Format本身会产生GC Alloc,需要慎用
20             if (EnableFormatStringOutput)
21                 Profiler.BeginSample(string.Format(formatName, args));
22             else
23                 Profiler.BeginSample(formatName);
24         }
25 #endif
26     }
27
28     public static void EndSample() {
29 #if ENABLE_PROFILER
30         if (EnableProfilerSample) {
31             Profiler.EndSample();
32         }
33 #endif
34     }
35 }