转载请注明出处:http://blog.csdn.net/crazy1235/article/details/55004841
基本使用
地图组件使用起来也很简单。
.wxml
<map id="map" longitude="{{longitude}}" latitude="{{latitude}}" scale="14" controls="{{controls}}" bindcontroltap="controltap" markers="{{markers}}" bindmarkertap="markertap" polyline="{{polyline}}" circles="{{circles}}" bindregionchange="regionchange" show-location style=" 100%; height: 350px;">
</map><map id="map" longitude="{{longitude}}" latitude="{{latitude}}" scale="14" controls="{{controls}}" bindcontroltap="controltap" markers="{{markers}}" bindmarkertap="markertap" polyline="{{polyline}}" circles="{{circles}}" bindregionchange="regionchange" show-location style=" 100%; height: 350px;"> </map>
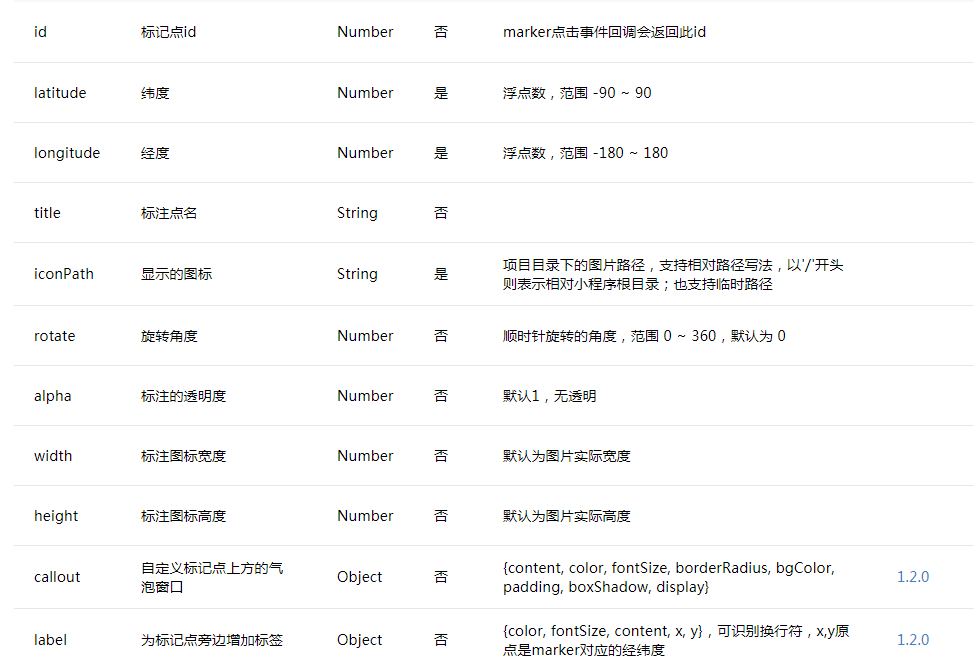
参数列表及说明如下:
除了显示基本地图,还可以在地图上添加markers–标注,polyline–折线,circles–圆形,controls–控件。
markers

data: {
    //
    markers: [{
      iconPath: "../../img/marker_red.png",
      id: 0,
      latitude: 40.002607,
      longitude: 116.487847,
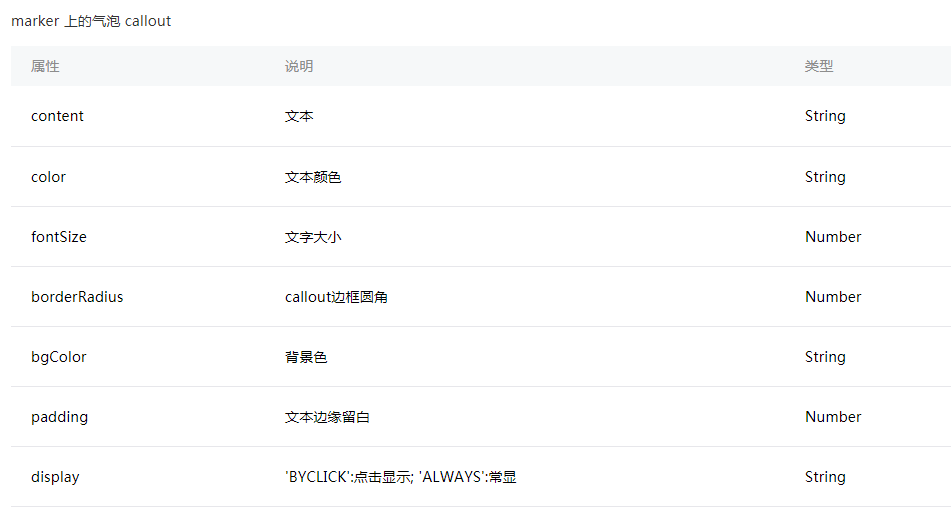
      callout:{
      }
       35,
      height: 45
    }],
    ... //省略代码
    }

#########################################################################在data中定义markers变量来表示覆盖物
然后map控件引入即可:
<map id="map" longitude="{{longitude}}"  markers="{{markers}}" style=" 100%; height: 350px;" ...//省略代码>
</map>


效果如下:
polyline
data: {
    //
    polyline: [{
      points: [{
        longitude: '116.481451',
        latitude: '40.006822'
      }, {
        longitude: '116.487847',
        latitude: '40.002607'
      }, {
        longitude: '116.496507',
        latitude: '40.006103'
      }],
      color: "#FF0000DD",
       3,
      dottedLine: true
    }],
    ... //省略代码
    }
<map id="map" longitude="{{longitude}}" latitude="{{latitude}}" polyline="{{polyline}}" style=" 100%; height: 350px;">- 1
circles
data: {
    //
    circles: [{
      latitude: '40.007153',
      longitude: '116.491081',
      color: '#FF0000DD',
      fillColor: '#7cb5ec88',
      radius: 400,
      strokeWidth: 2
    }],
    ... //省略代码
    }
<map id="map" longitude="{{longitude}}" latitude="{{latitude}}" circles="{{circles}}" style=" 100%; height: 350px;">- 1
效果如下:
controls
controls: [{
      id: 1,
      iconPath: '../../img/marker_yellow.png',
      position: {
        left: 0,
        top: 300 - 50,
         50,
        height: 50
      },
      clickable: true
}]<map id="map" controls="{{controls}}" bindcontroltap="controltap" style=" 100%; height: 350px;">- 1
control点击事件如下:
controltap: function (e) {
    console.log(e.controlId);
  },
其实可以通过在map上添加一个按钮,来实现诸如:定位、状态返回等操作。
(直接通过布局文件在map上添加view是显示不出来的)
绑定事件
BUG
关于经纬度,官方文档上都写的是Number类型。但是通过IDE调试的时候,写成字符串也是可以的。但是在IOS真机上运行时,markers却显示不出来,也不报错。
后来自己对照属性的类型,发现后台传来的经纬度是字符串类型的。而字符串类型的经纬度在IOS真机上经测试就是显示不出来。
所以将字符串转成Number类型即可。
百度地图API
百度地图团队的速度还是不错的!在小程序正式公测的第三天(2017.1.11)就发布了小程序版百度地图API
然而一期的功能并不多:
-
POI检索服务
-
POI检索热刺联想服务
-
逆地址解析服务
-
天气查询
关于这四个功能,大家自行去调用API就是了!
我要吐槽的是,为什么只有逆地址解析服务,没有地址编码服务呢?!
好吧,你不提供,我加上好吧!!
把参考 web服务API里关于地址编码的API ,在小程序里面封装一下即可!
其实上面看到的四个API也是从他们原有的web服务API中抽出来的 !
核心代码如下:
let startGeocoding = function (e) {
            wx.request({
                url: 'https://api.map.baidu.com/geocoder/v2/',
                data: geocodingparam,
                header: {
                    "content-type": "application/json"
                },
                method: 'GET',
                success(data) {
                    let res = data["data"];
                    if (res["status"] === 0) {
                        let result = res["result"];
                        // outputRes 包含两个对象,
                        // originalData为百度接口返回的原始数据
                        // wxMarkerData为小程序规范的marker格式
                        let outputRes = {};
                        outputRes["originalData"] = res;
                        outputRes["wxMarkerData"] = [];
                        outputRes["wxMarkerData"][0] = {
                            id: 0,
                            latitude: result["location"]['lat'],
                            longitude: result["location"]['lng'],
                            address: geocodingparam["address"],
                            iconPath: otherparam["iconPath"],
                            iconTapPath: otherparam["iconTapPath"],
                            desc: '',
                            business: '',
                            alpha: otherparam["alpha"],
                             otherparam["width"],
                            height: otherparam["height"]
                        }
                        otherparam.success(outputRes);
                    } else {
                        otherparam.fail({
                            errMsg: res["message"],
                            statusCode: res["status"]
                        });
                    }
                },
                fail(data) {
                    otherparam.fail(data);
                }
            });
        };
使用方法:
// 地理编码

  startGeocoding: function () {
    Bmap.geocoding({
      fail: fail,
      success: success,
      address: '北京大学',
      iconPath: '../../img/marker_red.png',
      iconTapPath: '../../img/marker_red.png'
    })
  },
然后我还对 静态图 这个API进行了小程序化!!!
/**
* 静态图
*
* @author ys
*
* @param {Object} param 检索配置
* http://lbsyun.baidu.com/index.php?title=static
*/
getStaticImage(param) {
var that = this;
param = param || {};
let staticimageparam = {
ak: that.ak2,
param["width"] || 400,
height: param["height"] || 300,
center: param["center"] || '北京', // 地址或者经纬度
scale: param["scale"] || 1, // 是否为高清图 返回图片大小会根据此标志调整。取值范围为1或2。 1表示返回的图片大小为size= width *height; 2表示返回图片为(width*2)*(height *2),且zoom加1 注:如果zoom为最大级别,则返回图片为(width*2)*(height*2),zoom不变。
zoom: param["zoom"] || 11, //高清图范围[3, 18];0低清图范围[3,19]
copyright: param["copyright"] || 1, // 0表示log+文字描述样式,1表示纯文字描述样式
markers: param["markers"] || null, // 标注,可通过经纬度或地址/地名描述;多个标注之间用竖线分隔
};
return "http://api.map.baidu.com/staticimage/v2?" + "ak=" + staticimageparam["ak"] + "&width=" + staticimageparam["width"] + "&height=" + staticimageparam["height"] + "¢er=" + staticimageparam["center"] + "&zoom=" + staticimageparam["zoom"] + "&scale=" + staticimageparam["scale"] + "©right=" + staticimageparam["copyright"];
}关于静态图,在web端调用的时候需要单独申请key,所以这里要在传入一个key!
在BMapWX构造函数中,传入ak2作为静态图的key
constructor(param) {
        this.ak = param["ak"];
        this.ak2 = param["ak2"];
    }
var Bmap = new bmap.BMapWX({
ak: 'xxxxxxxxxxx',
ak2: 'xxxxxxxxxxx'
});使用方法也很简单:
//获取静态图
  getStaticImage: function () {
    var url = Bmap.getStaticImage({
      scale: 2
    });
    console.log(url);
    that.setData({
      staticImageUrl: url
    })
  }
高德地图API
相比百度地图团队,高德地图团队更及时! 小程序公测第二天就发布了 小程序高德地图API
目前提供的功能有:
-
获取POI数据
-
获取地址描述数据
-
获取实时天气数据
-
获取输入提示词
-
路径规划
-
绘制静态图
在官网上,直接提供了路径规划的功能代码,和布局代码(.wxml & .wxss)
可见,高德还是比较靠谱的!
腾讯地图API
-
地点搜索
-
关键词输入提示
-
逆地址解析
-
地址解析
-
距离计算
-
获取城市列表
-
获取城市区县
注意
使用
-
map 组件是由客户端创建的原生组件,它的层级是最高的。
-
请勿在 scroll-view 中使用 map 组件。
-
css 动画对 map 组件无效。
百度地图小程序SDK扩展下载地址:


