- Linear regression
dataset:ex1data1.txt
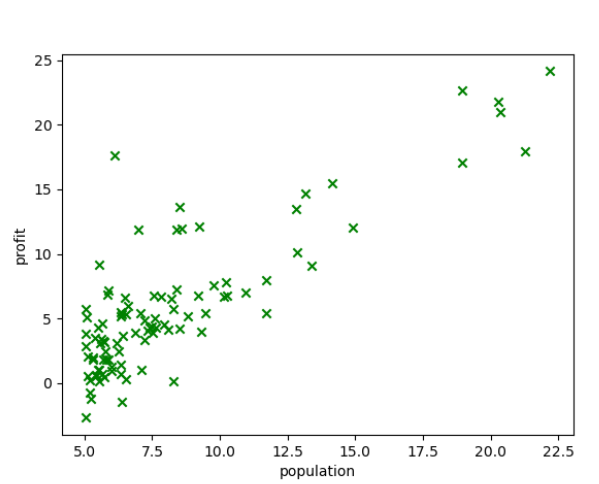
the 1st column is population of the city,the 2nd column is profit.
- Python pandas
Pandas 纳入了大量库和一些标准的数据模型,提供了高效地操作大型数据集所需的工具。pandas提供了大量能使我们快速便捷地处理数据的函数和方法。你很快就会发现,它是使Python成为强大而高效的数据分析环境的重要因素之一。
import pandas as pd

file="E:Coursera-ML-AndrewNg-Notes-mastercodeex1-linear regressionex1data1.txt"
data=pd.read_csv(file,header=None,names=["population","profit"]);#header:无表头names:设定表头
print(data.head())#5lines
output:
   population   profit
0      6.1101  17.5920
1      5.5277   9.1302
2      8.5186  13.6620
3      7.0032  11.8540
4      5.8598   6.8233
- Python numpy
NumPy(Numerical Python) 是 Python 语言的一个扩展程序库,支持大量的维度数组与矩阵运算,此外也针对数组运算提供大量的数学函数库。
- Matplotlib
Matplotlib 是 Python 的一个绘图库。它包含了大量的工具,你可以使用这些工具创建各种图形,包括简单的散点图,正弦曲线,甚至是三维图形。
import numpy as np
import matplotlib.pyplot as plt

x=data['population']
y=data['profit']
plt.scatter(x,y,c='g',marker='x')
plt.xlabel('population')
plt.ylabel('profit')
plt.show()
figure:
- hypothesis:
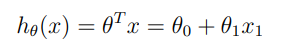
only one property in this case,when there are mutiple of properties,it will be like:
![]()
matrix:
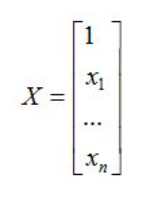
so a matrix with n properties and m training examples:

那个函数就是前行乘后列吧应该,线代忘光光.
use numpy to create a matrix and add a column ,all set as 1.theta is a (1,2) matrix. inplement a function to compute cost function J.
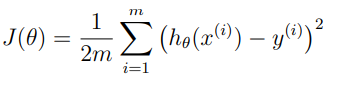
data.insert(0,'Ones',1)#row,name,value
X=data.loc[:,['Ones','population']]
y=data.loc[:,['profit']]
X=np.matrix(X.values)
y=np.matrix(y.values)
theta = np.matrix([0,0])
#print(X.head())
#print(y.head())
def computeCost(X,y,theta):
    inner = np.power(((X * theta.T) - y), 2)
    return np.sum(inner) / (2 * len(X))

print(computeCost(X, y, theta))
output:
32.072733877455676