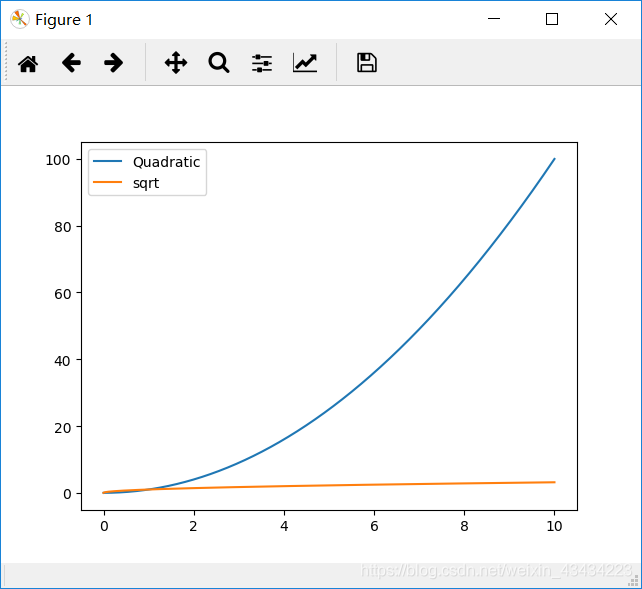
最简单的显示一张图的方法
x = np.linspace(0,10 , 1000)

plt.plot(x, x**2, label = "Quadratic")
plt.plot(x, x**0.5, label = "sqrt")
#将图形呈现在屏幕上
plt.legend()
plt.show()
认识matplotlib的结构
Figure
在任何绘图之前,我们需要一个Figure对象,可以理解成我们需要一张画板才能开始绘图。
import matplotlib as plt
import numpy as np

fig = plt.figure()
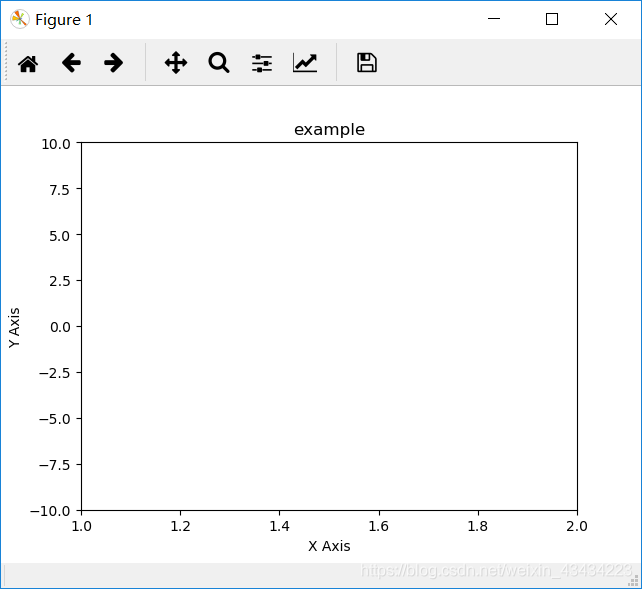
Axes
有了画板后我们还需要一张纸,这样我们才可以作画,这就是我们添加的.axes.Axes对象,下面的代码创建了“纸”的同时,在纸上添加了x,y的取值范围,标题,x,y的轴名
fig = plt.figure()
#这个语句就是添加了Axes对象,
ax = fig.add_subplot(111)
ax.set(xlim = [1,2],ylim = [-10,10],title = "example", xlabel = "X Axis", ylabel = "Y Axis")

plt.show()
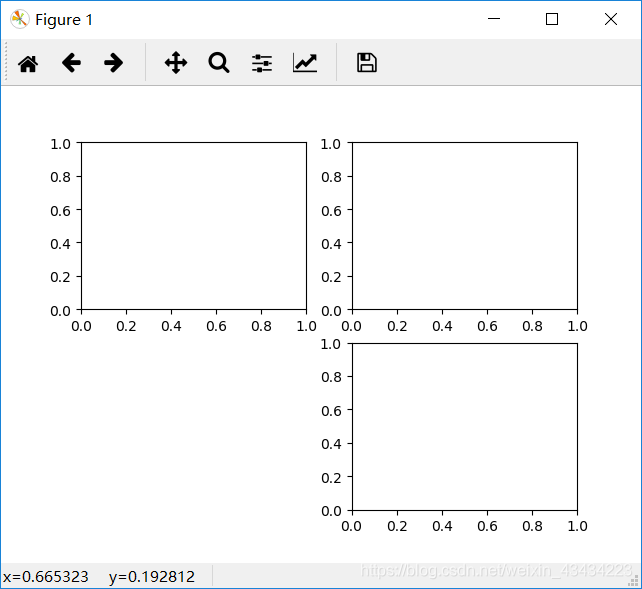
对于上面的fig.add_subplot(111)就是添加Axes的,参数的解释的在画板的第1行第1列的第一个位置生成一个Axes对象来准备作画。也可以通过fig.add_subplot(2, 2, 1)的方式生成Axes,前面两个参数确定了面板的划分,例如 2, 2会将整个面板划分成 2 * 2 的方格,第三个参数取值范围是 [1, 2*2] 表示第几个Axes。如下面的例子:
fig = plt.figure()
ax1 = fig.add_subplot(221)
ax2 = fig.add_subplot(222)
ax3 = fig.add_subplot(224)
效果如图
Multiple Axes
可以发现向上述一样添加Axes对象很慢,所以提供了下面的方式一次性生成所有 Axes
fig, axex = plt.subplots(nrows = 2, ncols = 2)
axes[0,0].set(title='Upper Left')
axes[0,1].set(title='Upper Right')
axes[1,0].set(title='Lower Left')
axes[1,1].set(title='Lower Right')
这样我们就完成了四幅图的属性设置
Axes 和 pyplot对比
相信不少人看过下面的代码,很简单并易懂,但是下面的作画方式只适合简单的绘图,快速的将图绘出。在处理复杂的绘图工作时,我们还是需要使用 Axes 来完成作画的。
plt.plot([1, 2, 3, 4], [10, 20, 25, 30], color='lightblue', linewidth=3)
plt.xlim(0.5, 4.5)
plt.show()
2D基本绘图
- 线
fig = plt.figure()
ax1 = fig.add_subplot(221)
ax2 = fig.add_subplot(222)
ax3 = fig.add_subplot(224)
x = np.linspace(10,20 ,1000)
y_sinx = np.sin(x)
y_cosx = np.cos(x)
ax1.plot(x, y_sinx)
ax2.plot(x, y_sinx, 'go--', linewidth=2, markersize=12)
ax3.plot(x, y_cosx, color='red', marker='+')
plt.show()
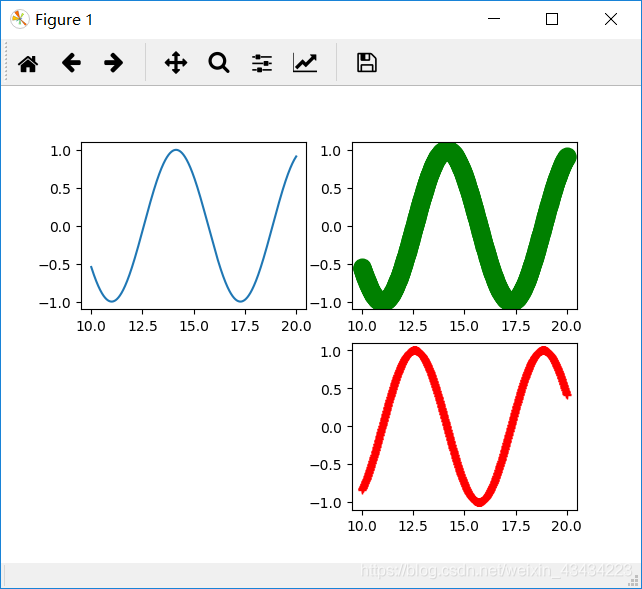
在上面的三个Axes上作画。plot,前面两个参数为x轴、y轴数据。ax2的第三个参数是 MATLAB风格的绘图,对应ax3上的颜色,marker,线型。