Percona Monitoring and Management (PMM)是一款开源的用于管理和监控MySQL和MongoDB性能的开源平台
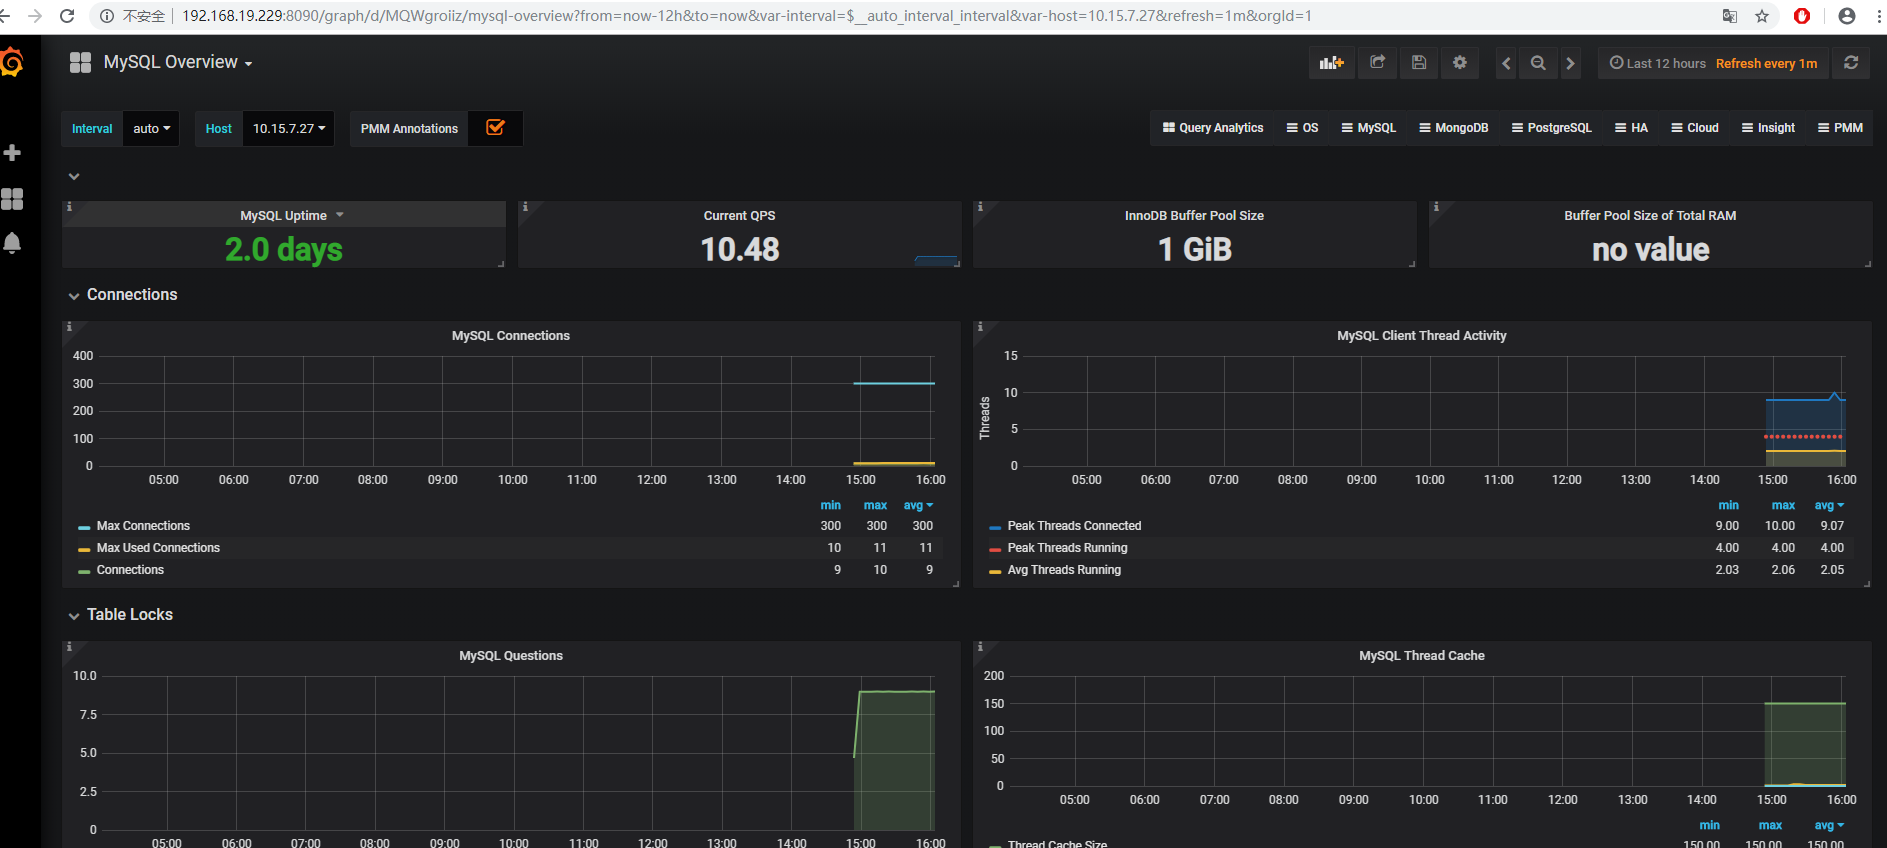
通过PMM客户端收集到的DB监控数据用第三方软件Grafana画图展示出来
PMM提供了对MyISAM、InnoDB、TokuDB和PXC/Glarera的监控,另外也提供了Query Analytics的功能,可以
检视执行了哪些SQL指令,并对执行效能较差的语法进行优化。另外在新版本还支持了MySQL复制拓扑图结构构造
1 安装
wget -O /etc/yum.repos.d/CentOS-Base.repo http://mirrors.aliyun.com/repo/Centos-7.repo
yum clean all
yum makecache
yum install -y epel-release
yum install docker -y
systemctl start docker
docker pull percona/pmm-server:latest
查看镜像
[root@jenkins opt]# docker images
REPOSITORY                     TAG                 IMAGE ID            CREATED             SIZE
docker.io/percona/pmm-server   latest              deac61541b67        5 months ago        1.08 GB
[root@jenkins opt]# docker version
Client:
 Version:         1.13.1
 API version:     1.26
 Package version: docker-1.13.1-102.git7f2769b.el7.centos.x86_64
 Go version:      go1.10.3
 Git commit:      7f2769b/1.13.1
 Built:           Mon Aug  5 15:09:42 2019
 OS/Arch:         linux/amd64

Server:
 Version:         1.13.1
 API version:     1.26 (minimum version 1.12)
 Package version: docker-1.13.1-102.git7f2769b.el7.centos.x86_64
 Go version:      go1.10.3
 Git commit:      7f2769b/1.13.1
 Built:           Mon Aug  5 15:09:42 2019
 OS/Arch:         linux/amd64
 Experimental:    false
--关闭防火墙,禁用selinux
groupadd docker
useradd -g docker docker
创建容器
[docker@jenkins ~]$ docker create
>    -v /opt/prometheus/data
>    -v /opt/consul-data
>    -v /var/lib/mysql
>    -v /var/lib/grafana
>    --name pmm-data
>    docker.io/percona/pmm-server /bin/true
fc92bd7d4bcc2e2014cbb5a03584ea269e8cea0e268aca4901a6827cf4570529
启动容器
[docker@jenkins ~]$ docker run -d    -p 8090:80    --volumes-from pmm-data    --name pmm-server    --restart always    docker.io/percona/pmm-server
8d925d326813083143c04ff6155617738624f4a9e8c6792ae6200bd78e05a214
安装pmm-client
[root@jenkins opt]# rpm -ivh pmm-client-1.17.1-1.el7.x86_64.rpm
warning: pmm-client-1.17.1-1.el7.x86_64.rpm: Header V4 RSA/SHA256 Signature, key ID 8507efa5: NOKEY
Preparing...                          ################################# [100%]
Updating / installing...
   1:pmm-client-1.17.1-1.el7          ################################# [100%]
配置server
[root@jenkins opt]# pmm-admin config --server 192.168.19.229:8090
OK, PMM server is alive.

PMM Server      | 192.168.19.229:8090
Client Name     | jenkins
Client Address  | 192.168.19.229
创建mysql监控账号
(root@localhost:mysql.sock) [(none)]> create user 'monitor'@'%' identified by '***';
Query OK, 0 rows affected (0.47 sec)
(root@localhost:mysql.sock) [(none)]> grant all privileges on *.* to 'monitor'@'%';
Query OK, 0 rows affected (0.02 sec)
(root@localhost:mysql.sock) [(none)]> flush privileges;
Query OK, 0 rows affected (0.21 sec)
添加remote mysql实例
[root@jenkins opt]# pmm-admin add mysql --user monitor --password *** --host 10.15.7.29
[linux:metrics] OK, now monitoring this system.
[mysql:metrics] OK, now monitoring MySQL metrics using DSN monitor:***@tcp(10.15.7.29:3306)
[mysql:queries] OK, now monitoring MySQL queries from perfschema using DSN monitor:***@tcp(10.15.7.29:3306)
[root@jenkins opt]# pmm-admin list
pmm-admin 1.17.1

PMM Server      | 192.168.19.229:8090
Client Name     | jenkins
Client Address  | 192.168.19.229
Service Manager | linux-systemd

-------------- -------- ----------- -------- --------------------------------- ---------------------------------------------
SERVICE TYPE   NAME     LOCAL PORT  RUNNING  DATA SOURCE                       OPTIONS
-------------- -------- ----------- -------- --------------------------------- ---------------------------------------------
mysql:queries  jenkins  -           YES      monitor:***@tcp(10.15.7.29:3306)  query_source=perfschema, query_examples=true
linux:metrics  jenkins  42000       YES      -
mysql:metrics  jenkins  42002       YES      monitor:***@tcp(10.15.7.29:3306)
[root@jenkins opt]# pmm-admin check-network
PMM Network Status

Server Address | 192.168.19.229:8090
Client Address | 192.168.19.229

* System Time
NTP Server (0.pool.ntp.org)         | 2019-08-08 06:25:51 +0000 UTC
PMM Server                          | 2019-08-08 06:25:50 +0000 GMT
PMM Client                          | 2019-08-08 14:25:52 +0800 CST
PMM Server Time Drift               | OK
PMM Client Time Drift               | OK
PMM Client to PMM Server Time Drift | OK

* Connection: Client --> Server
-------------------- -------
SERVER SERVICE       STATUS
-------------------- -------
Consul API           OK
Prometheus API       OK
Query Analytics API  OK

Connection duration | 372.087µs
Request duration    | 5.621825ms
Full round trip     | 5.993912ms


* Connection: Client <-- Server
-------------- -------- --------------------- ------- ---------- ---------
SERVICE TYPE   NAME     REMOTE ENDPOINT       STATUS  HTTPS/TLS  PASSWORD
-------------- -------- --------------------- ------- ---------- ---------
linux:metrics  jenkins  192.168.19.229:42000  OK      YES        -
mysql:metrics  jenkins  192.168.19.229:42002  OK      YES        -