树图网可视化实验
1. 实验要求
要求通过树,或者图、网的可视化聚类,分析某个公司的邮件社交网络。根据要求设计可视化方案,并利用D3工具实现可视化效果。
2. 过程
2.1. 可视化方案的设计思路
2.1.1. 可视化要求
1) 可视化该邮件社交网络。
2) 该可视化中的每个Edge都对应着一个权重(Emails per month或者weight),要求将该权重属性映射到一个图形化的属性,比如,color,types of line,size or shapes。
3) 可视化方案中要体现每个人的职业或部门属性(五类):director,CEO,Business Development Unit,Business Support Unit,Business Control Unit。
2.1.2. 设计思路
根据可视化要求,分析某个公司的邮件社交网络,并可视化该邮件社交网络。
1. 可视化效果应该是一张图;
2. 这张图中的顶点要分为5类,体现每个人的职业或部门属性;
3. 这张图中的边要分为7类,体现不同的权值;
4. 每类顶点放在一起,并将不同顶点用不同颜色标识。
2.2. 对可视化方案的说明
在此次的设计方案中,将使用弦图进行可视化。弦图的各弧代表各个人,弧的角度大小代表其收件箱内的邮件个数,弧被分为5种颜色,体现每个人的部门属性。弦图的各弦代表两个人之间的邮件往来,如A、B间的弦,与A相连的一端代表A收件箱中来自B的邮件,与B相连的一端代表B收件箱中来自A的邮件,弦被分为7种宽度,体现来往信件的多少。
2.3. 使用D3实现可视化效果的过程
2.3.1. 新建项目
在项目目录下新建文件夹lab_3,再在文件夹lab_3内新建一个文件夹d3和文本文件index.html
2.3.2. 数据预处理
将原始数据保存为staff.csv和mails.csv
2.3.3. 编写代码
html.index
<!DOCTYPE HTML>
<html>
<head>
    <meta charset="utf-8">
    <title>My lab 3</title>
    <style>

        @import url(../style.css?aea6f0a);

        #circle circle {
            fill: none;
            pointer-events: all;
        }

        .group path {
            fill-opacity: .5;
        }

        path.chord {
            stroke: #000;
            stroke-width: .25px;
        }

        #circle:hover path.fade {
            display: none;
        }

        .Director {
            fill: navy;
        }

        .CEO {
            fill: black;
        }

        #group3, #group6, #group7, #group8 {
            fill: #00FF7F;
        }
        #group4, #group9, #group10, #group11, #group12, #group13, #group14 {
            fill: #DAA520;
        }
        #group5, #group16, #group17, #group15 {
            fill: #FF00FF;
        }
    </style>
</head>

<body>
    <script src="d3/d3.js" charset="utf-8"></script>
    <script src="d3/queue.js"></script>
    <script>
        var matrix = new Array(18);

        var width = 720,
            height = 720,
            outerRadius = Math.min(width, height) / 2 - 10,
            innerRadius = outerRadius - 24;   // 设置布局的长宽,半径

        var formatPercent = d3.format(".1%");

        var layout = d3.layout.chord()    // 从关系矩阵生成一个弦图,创建弦图布局,用来转换数据
            .padding(.04)     // 取得或设置 弦片段间的角填充
            .sortSubgroups(d3.descending)     // 取得或设置 用于子分组的比较器
            .sortChords(d3.ascending);    // 取得或设置 用于弦的比较器(Z轴顺序)

        var arc = d3.svg.arc()      // 新建一个弧度生成器,用来画弧
            .innerRadius(innerRadius)     // 设置内半径访问器
            .outerRadius(outerRadius);    // 设置外半径访问器

        var path = d3.svg.chord()     // 新建一个弦生成器,用来画弦
            .radius(innerRadius);

        var svg = d3.select("body").append("svg")     // 生成最父节点
            .attr("width", width)
            .attr("height", height)
          .append("g")
            .attr("id", "circle")
            .attr("transform", "translate(" + width / 2 + "," + height / 2 + ")");    // 坐标原点移到svg中间

        svg.append("circle")
            .attr("r", outerRadius);    // 画外圈的大圆,g的第一个孩子

        queue()
            .defer(d3.csv, "staff.csv")
            .defer(d3.csv, "mails.csv")
            .await(ready);    // 加载两个文件,之后执行回掉函数ready

        function ready(error, staffs, mails) {
              if (error) throw error;

              // 生成数据矩阵
              for (var i = 0; i < 18; i++)
              {
                      matrix[i] = new Array(18);
                      for (var j = 0; j < 18; j++)
                      {
                          matrix[i][j] = 0;
                      }
              }

              for (var i = 0; i < mails.length; i++)
              {
                       var toid1 = parseInt(mails[i].toID);
                      var id2 = parseInt(mails[i].ID);
                      var num = parseInt(mails[i].Weight);
                      matrix[toid1][id2] = num;
              }
              // Compute the chord layout. 加载数据矩阵
              layout.matrix(matrix);

              // Add a group per neighborhood. 就是每一个扇环形区域,都是一个group,包括title、path(arc)、text三个孩子
              var group = svg.selectAll(".group")
                  .data(layout.groups)    // layout = d3.layout.chord() ,所以layout是个chord;
                                          // chord.group()返回节点数组,用来生成节点:一个个弧
                .enter().append("g")
                  .attr("class", "group")
                  .on("mouseover", mouseover);    // 放上鼠标后调用mouseover函数


              // Add a mouseover title. 鼠标停留显示的提示
              group.append("title").text(function(d, i) { return staffs[i].Name + "'s inbox"; });

              // Add the group arc. 画弧
              var groupPath = group.append("path")
                  .attr("id", function(d, i) { return "group" + i; })   // 每个扇环形区域是一个group,其中的path叫group i
                  .attr("d", arc)
                  .attr("class", function(d, i) { return staffs[i].Position; });


              // Add a text label. 添加文本标识
              var groupText = group.append("text")
                  .attr("x", 6)
                  .attr("dy", 15);

              groupText.append("textPath")
                  .attr("xlink:href", function(d, i) { return "#group" + i; })
                  .text( function(d, i) { return staffs[i].Name; } );

              // Remove the labels that don't fit. :(
              groupText.filter(function(d, i) { return groupPath[0][i].getTotalLength() / 2 - 16 < this.getComputedTextLength(); })
                  .remove();


              // Add the chords. 每条连接两个邻居的边都是一个path,拥有一个title孩子,所有的边在一起叫chord
              var chord = svg.selectAll(".chord")
                  .data(layout.chords)
                .enter().append("path")
                  .attr("class", "chord")
                  .style("fill", "#1E90FF")
                  .attr("d", path);

              // Add an elaborate mouseover title for each chord. 设置path的title
              // chord.append("title").text("haha");

              // 在此函数中,所有不是source也不是target的全都设"fade"为true
              function mouseover(d, i) {
                chord.classed("fade", function(p) {
                  return p.source.index != i
                      && p.target.index != i;
                });
              }
        }
    </script>
</body>
</html>
数据:mails.csv
ID,Emailspermonth,Weight,toID
0,5,1,1
0,6,1,2
1,5,1,2
2,25,2,3
2,36,2,4
2,53,3,5
3,150,4,6
3,213,5,7
3,298,5,8
4,345,6,9
4,123,4,10
4,212,5,11
4,453,7,12
4,156,4,13
4,278,5,14
5,300,5,15
5,78,3,16
5,256,5,17
6,78,3,7
6,145,4,8
7,139,4,8
9,34,2,10
9,134,4,11
9,546,7,12
9,23,2,13
9,145,4,14
10,256,5,11
10,222,5,12
10,190,4,12
10,56,3,14
11,78,3,12
11,112,4,13
12,98,3,14
15,88,3,16
15,123,4,17
16,238,5,17
17,5,1,7
16,15,2,6
16,23,2,7
16,54,3,8
16,18,2,9
16,23,2,11
16,41,2,13
16,13,2,14
16,27,2,10
数据:staff.csv
ID,Name,Position
0,James,Director
1,David,Director
2,George,CEO
3,Ronald,Business Development Manager
4,John,Business Support Manager
5,Richard,Business Control Manager
6,Daniel,Sales Department Leader
7,Kenneth,Product Department Leader
8,Anthony,Marketing Department Leader
9,Robert,Project Office Leader
10,Charles,Professional Service Leader
11,Paul,QA Leader
12,Mark,Design Office Leader
13,Kevin,Technical Support Office Leader
14,Edward,Software Development Leader
15,Joseph,Legal Office Leader
16,Michael,Finance Office Leader
17,Jason,HR Office Leader
3. 结果
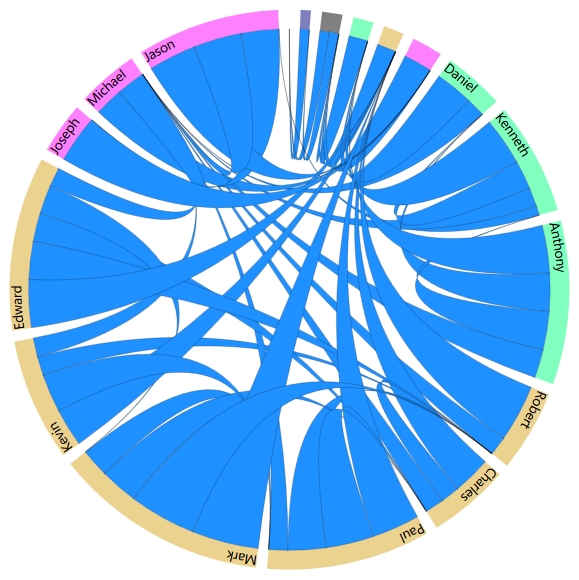
图1 数据弦图
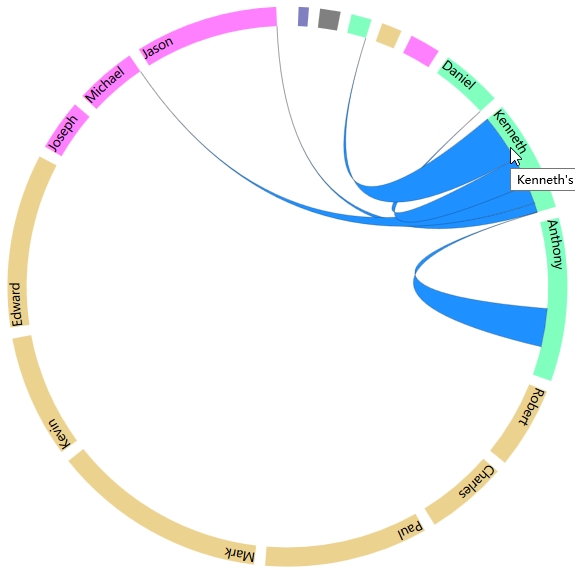
图2 鼠标移到某员工,显示该员工所有的邮件往来
4. 总结
使用弦图能清晰地显示各部门、各员工之间的邮件往来,有良好的可视化效果。