zoukankan      html  css  js  c++  java
  • ECharts 使用总结

    1、去掉Echarts 图标上边框和右边框

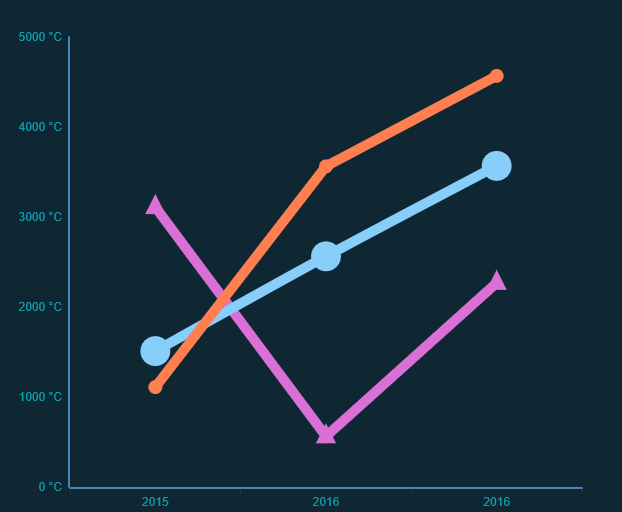
    option = {
          title: {
                       text: '未来一周气温变化',
                       subtext: '纯属虚构'
                  },
           grid: {
                       show: 'true',
                        borderWidth: '0',
                     },
          tooltip: {
                       trigger: 'axis'
                       },

    2、去掉 去除网格线、网格区域

        xAxis: [
                            {
                                splitLine: {
                                    show: false,
                                },//去除网格线
                                splitArea: { show: false },//保留网格区域
                                type: 'category',
                                boundaryGap: false,
                                data: ['2015', '2016', '2016']
                            }
                        ],
                        yAxis: [
                            {
                                splitLine: { show: false },//去除网格线
                                splitArea: { show: false },//保留网格区域
                                type: 'value',
                                axisLabel: {
                                    formatter: '{value} °C'
                                }
                            }
                        ],

    3、折线图折线加粗

            series: [
                            {
                                name: '最高气温',
                                type: 'line',
                                data: [1110,2563,4568],
                                itemStyle: {
                                    normal: {
                                        lineStyle: {
                                             10
                                        }
                                    }
                                }
    
                            },

    4、图表展示不靠边

       xAxis: [
                            {
                                axisLabel: {
                                    show: true,
                                    textStyle: {
                                        color: "#109cad"
                                    }
                                },
                                splitLine: {
                                    show: false,
                                },//去除网格线
                                splitArea: { show: false },//保留网格区域
                                type: 'category',
                                boundaryGap: true,
                                data: ['2015', '2016', '2016']
                            }
                        ],

    5、去掉右边和上边的边框

     option3 = {
                        title: {
                            //text: '世界人口总量',
                            //subtext: '数据来自网络'
                        },
                        grid: {
                            show: 'true',
                            borderWidth: '0',
                        },
                        tooltip: {
                            trigger: 'axis'
                        },

    6、X、Y 轴文字加粗

       xAxis: [
                            {
                                type: 'value',
                                splitLine: { show: false },//去除网格线
                                axisLine: { lineStyle: { color: '#0087ED' } },
                                axisLabel: {
                                    show: true,
                                    textStyle: {
                                        color: "#109cad",   //改变字体颜色
                                        fontSize: 18,
                                        fontFamily: 'microsoft yahei light',
                                        fontWeight: 700
                                    }
                                },
                               // boundaryGap: [0, 0.01]
                            }
                        ],

    7、地图颜色修改、地图上文字修改

       legend: {
                            show: true,
                            orient: 'vertical',
                            x: 'left',
                            y: 'bottom',
                            itemGap: 20,
                            textStyle: {
                                fontSize: '20px',
                                fontWeight: 'bold'
                            },
                            data: [],
    
                            textStyle: {
                                color: '#fff'    //地图山文字颜色修改
                            }
                        },
    
    
                        series: [
                            {
                                name: '全国',
                                type: 'map',
                                roam: true,
                                hoverable: false,
                                mapType: '江苏|南京市',
                                itemStyle: {
                                    normal: {
                                        borderColor: 'rgba(100,149,237,1)',
                                        borderWidth: 0.5,
                                        areaStyle: {
                                            color: '#CCCCCC'     //地图颜色修改
                                        }
                                    }
                                },
                                data: [],
  • 相关阅读:
    UtraEdit 不启用语法彩色显示
    XXX 不是当前用户的有效责任,请联系您的系统管理员
    子帐 SLA(SubLedger Accounting)
    518 vue组件的data是函数,不是对象
    517 vue注册组件语法糖,模板的分离写法
    516 vue父组件和子组件
    515 vue全局组件和局部组件
    514 vue组件化开发概述,注册组件的基本步骤
    513 v-model:表单绑定,原理,radio,checkbox,select,修饰符,值绑定
    512 高阶函数 filter、map、reduce
  • 原文地址:https://www.cnblogs.com/youmingkuang/p/8302838.html
Copyright © 2011-2022 走看看