ELKStack之操作深入(中)
链接:https://pan.baidu.com/s/1V2aYpB86ZzxL21Hf-AF1rA
提取码:7izv
复制这段内容后打开百度网盘手机App,操作更方便哦
1. 企业级Elasticsearch使用详解
1.1 基本概念
Elasticsearch MySQL
Index Database
Type Table
Document Row
Field Column
- Node:运行单个ES实例的服务器
- Cluster:一个或多个节点构成集群
- Index:索引是多个文档的集合(必须是小写字母)
- Document:Index里每条记录称为Document,若干文档构建一个Index
- Type:一个Index可以定义一种或多种类型,将Document逻辑分组
- Field:ES存储的最小单元
- Shards:ES将Index分为若干份,每一份就是一个分片。
- Replicas:Index的一份或多份副本
1.2 实验环境说明
| 主机名 | 主机IP | 用途 |
|---|---|---|
| ES1 | 192.168.200.16 | elasticsearch-node1 |
| ES2 | 192.168.200.17 | elasticsearch-node2 |
| ES3 | 192.168.200.18 | elasticsearch-node3 |
| Logstash-Kibana | 192.168.200.19 | 日志可视化服务器 |
#安装环境
[root@ES1 ~]# cat /etc/redhat-release
CentOS Linux release 7.6.1810 (Core)
[root@ES1 ~]# uname -r
3.10.0-957.12.1.el7.x86_64
[root@ES1 ~]# systemctl stop firewalld
[root@ES1 ~]# setenforce 0
setenforce: SELinux is disabled
#更换亚洲时区
[root@ES1 ~]# /bin/cp /usr/share/zoneinfo/Asia/Shanghai /etc/localtime

#安装时间同步
[root@ES1 ~]# yum -y install ntpdate
[root@ES1 ~]# which ntpdate
/usr/sbin/ntpdate

#进行时间同步
[root@ES1 ~]# ntpdate ntp1.aliyun.com
27 Aug 22:29:56 ntpdate[7009]: adjust time server 120.25.115.20 offset 0.028693 sec
1.3 企业级Elasticsearch集群部署
在三台ES上都进行如下操作
1.3.1 安装jdk
#yum安装jdk1.8
[root@ES1 ~]# yum -y install java-1.8.0-openjdk

#导入yum方式安装ES的公钥
[root@ES1 ~]# rpm --import https://artifacts.elastic.co/GPG-KEY-elasticsearch
1.3.2 添加ES的yum源文件
[root@ES1 ~]# vim /etc/yum.repos.d/elastic.repo
[root@ES1 ~]# cat /etc/yum.repos.d/elastic.repo
[elastic-6.x]

name=Elastic repository for 6.x packages
baseurl=https://artifacts.elastic.co/packages/6.x/yum
gpgcheck=1
gpgkey=https://artifacts.elastic.co/GPG-KEY-elasticsearch
enabled=1
autorefresh=1
type=rpm-md
1.3.3 安装并修改elasticsearch的配置文件
#安装elasticsearch
[root@ES1 ~]# yum -y install elasticsearch

#配置elasticsearch的配置文件
[root@ES1 ~]# cd /etc/elasticsearch/
[root@ES1 elasticsearch]# cp -a elasticsearch.yml elasticsearch.yml_bak

#修改前elasticsearch配置文件
[root@ES1 elasticsearch]# cat -n /etc/elasticsearch/elasticsearch.yml_bak | sed -n '17p;23p;33p;37p;55p;59p;68p;72p'
    17	#cluster.name: my-application
    23	#node.name: node-1
    33	path.data: /var/lib/elasticsearch
    37	path.logs: /var/log/elasticsearch
    55	#network.host: 192.168.0.1
    59	#http.port: 9200
    68	#discovery.zen.ping.unicast.hosts: ["host1", "host2"]
    72	#discovery.zen.minimum_master_nodes:

#修改后elasticsearch配置文件
[root@ES1 elasticsearch]# cat -n /etc/elasticsearch/elasticsearch.yml | sed -n '17p;23p;33p;37p;55p;59p;68p;72p'
    17	cluster.name: elk-cluster
    23	node.name: node-1
    33	path.data: /var/lib/elasticsearch
    37	path.logs: /var/log/elasticsearch
    55	network.host: 192.168.200.16
    59	http.port: 9200
    68	discovery.zen.ping.unicast.hosts: ["192.168.200.16", "192.168.200.17","192.168.200.18"]
    72	discovery.zen.minimum_master_nodes: 2
#将ES1配置文件拷贝到ES2和ES3
[root@ES1 elasticsearch]# scp /etc/elasticsearch/elasticsearch.yml 192.168.200.17:/etc/elasticsearch/
root@192.168.200.17's password:
elasticsearch.yml                                                          100% 2899     2.0MB/s   00:00
[root@ES1 elasticsearch]# scp /etc/elasticsearch/elasticsearch.yml 192.168.200.18:/etc/elasticsearch/
root@192.168.200.18's password:
elasticsearch.yml                                                          100% 2899     2.1MB/s   00:00

#只需要修改ES2和ES3的节点名称和监听端口即可
[root@ES2 elasticsearch]# cat -n /etc/elasticsearch/elasticsearch.yml | sed -n '17p;23p;33p;37p;55p;59p;68p;72p'
    17	cluster.name: elk-cluster
    23	node.name: node-2
    33	path.data: /var/lib/elasticsearch
    37	path.logs: /var/log/elasticsearch
    55	network.host: 192.168.200.17
    59	http.port: 9200
    68	discovery.zen.ping.unicast.hosts: ["192.168.200.16", "192.168.200.17","192.168.200.18"]
    72	discovery.zen.minimum_master_nodes: 2

[root@ES3 elasticsearch]# cat -n /etc/elasticsearch/elasticsearch.yml | sed -n '17p;23p;33p;37p;55p;59p;68p;72p'
    17	cluster.name: elk-cluster
    23	node.name: node-3
    33	path.data: /var/lib/elasticsearch
    37	path.logs: /var/log/elasticsearch
    55	network.host: 192.168.200.18
    59	http.port: 9200
    68	discovery.zen.ping.unicast.hosts: ["192.168.200.16", "192.168.200.17","192.168.200.18"]
    72	discovery.zen.minimum_master_nodes: 2
1.3.4 启动三台ES上的elasticsearch
[root@ES1 elasticsearch]# systemctl start elasticsearch
[root@ES2 elasticsearch]# systemctl start elasticsearch
[root@ES3 elasticsearch]# systemctl start elasticsearch
1.3.5 查看集群节点的健康情况
[root@ES1 elasticsearch]# curl -X GET "192.168.200.16:9200/_cat/health?v"
epoch      timestamp cluster     status node.total node.data shards pri relo init unassign pending_tasks max_task_wait_time active_shards_percent
1567046042 02:34:02  elk-cluster green           3         3      0   0    0    0        0             0                  -                100.0%
1.4 Elasticsearch数据操作
RestFul API格式:curl -X<verb> '<protocol>://<host>:<port>/<path>?<query_string>' -d '<body>'
| 参数 | 描述 |
|---|---|
| verb | HTTP方法,比如GET,POST,PUT,HEAD,DELETE |
| host | ES集群中的任意节点主机名 |
| port | ES HTTP服务端口,默认9200 |
| path | 索引路径 |
| query_string | 可选的查询请求参数。例如?pretty参数将格式化输出JSON数据 |
| -d | 里面放一个GET的JSON格式请求主体 |
| body | 自己写的JSON格式的请求主体 |
#列出数据库所有的索引
[root@ES1 ~]# curl -X GET "192.168.200.16:9200/_cat/indices?v"
health status index uuid pri rep docs.count docs.deleted store.size pri.store.size

#创建一个索引
[root@ES1 ~]# curl -X PUT "192.168.200.16:9200/logs-test-2019.08.29"
{"acknowledged":true,"shards_acknowledged":true,"index":"logs-test-2019.08.29"}

#查看数据库所有索引
[root@ES1 ~]# curl -X GET "192.168.200.16:9200/_cat/indices?v"
health status index                uuid                   pri rep docs.count docs.deleted store.size pri.store.size
green  open   logs-test-2019.08.29 Yua-9GCmROOmCgqotJ_31w   5   1          0            0      2.2kb          1.1kb
1.5 Head插件图形管理Elasticsearch
1.5.1 head插件下载
[root@ES1 ~]# wget https://npm.taobao.org/mirrors/node/latest-v4.x/node-v4.4.7-linux-x64.tar.gz
[root@ES1 ~]# ll -d node-v4.4.7-linux-x64.tar.gz
-rw-r--r-- 1 root root 12189839 6月  29 2016 node-v4.4.7-linux-x64.tar.gz

[root@ES1 ~]# tar xf node-v4.4.7-linux-x64.tar.gz -C /usr/local/
[root@ES1 ~]# mv /usr/local/node-v4.4.7-linux-x64/ /usr/local/node-v4.4
[root@ES1 ~]# echo -e 'NODE_HOME=/usr/local/node-v4.4
PATH=$NODE_HOME/bin:$PATH
export NODE_HOME PATH' >> /etc/profile
[root@ES1 ~]# tail -3 /etc/profile
NODE_HOME=/usr/local/node-v4.4
PATH=$NODE_HOME/bin:$PATH
export NODE_HOME PATH
[root@ES1 ~]# source /etc/profile
1.5.2 安装git客户端
#yum安装git
[root@ES1 ~]# yum -y install git

#切换国内源
[root@ES1 ~]# npm config set registry http://registry.npm.taobao.org
#git拉取elasticsearch-head代码
[root@ES1 ~]# git clone git://github.com/mobz/elasticsearch-head.git
正克隆到 'elasticsearch-head'...
remote: Enumerating objects: 73, done.
remote: Counting objects: 100% (73/73), done.
remote: Compressing objects: 100% (53/53), done.
remote: Total 4333 (delta 36), reused 46 (delta 17), pack-reused 4260
接收对象中: 100% (4333/4333), 2.51 MiB | 29.00 KiB/s, done.
处理 delta 中: 100% (2409/2409), done.

[root@ES1 ~]# cd elasticsearch-head/
[root@ES1 elasticsearch-head]# npm install
#以下省略若干。。。

#特别提示:此安装过程报错也没关系,不影响使用
npm install命令详解(https://blog.csdn.net/csdn_yudong/article/details/83721870)
#修改源码包配置文件Gruntfile.js(在99行处下边增加一行代码如下)
[root@ES1 elasticsearch-head]# cat -n Gruntfile.js | sed -n '94,101p'
    94			connect: {
    95				server: {
    96					options: {
    97						port: 9100,
    98						base: '.',
    99						keepalive: true,    #添加一个逗号
   100	                    hostname: '*'       #增加本行代码
   101					}
1.5.3 启动head插件
[root@ES1 elasticsearch-head]# npm run start

> elasticsearch-head@0.0.0 start /root/elasticsearch-head
> grunt server

Running "connect:server" (connect) task
Waiting forever...
Started connect web server on http://localhost:9100
1.5.4 浏览器上访问http://192.168.200.16:9100

虽然浏览器上我们打开了,但是我们发现插件无法连接elasticsearch的API,这是因为ES5.0+版本以后,要想连接API必须先要进行授权才行。
1.5.5 先ES配置文件添加两行代码
[root@ES1 elasticsearch-head]# echo -e 'http.cors.enabled: true
http.cors.allow-origin: "*"' >> /etc/elasticsearch/elasticsearch.yml
[root@ES1 elasticsearch-head]# tail -2 /etc/elasticsearch/elasticsearch.yml
http.cors.enabled: true
http.cors.allow-origin: "*"

#重启动elasticsearch
[root@ES1 elasticsearch-head]# systemctl restart elasticsearch
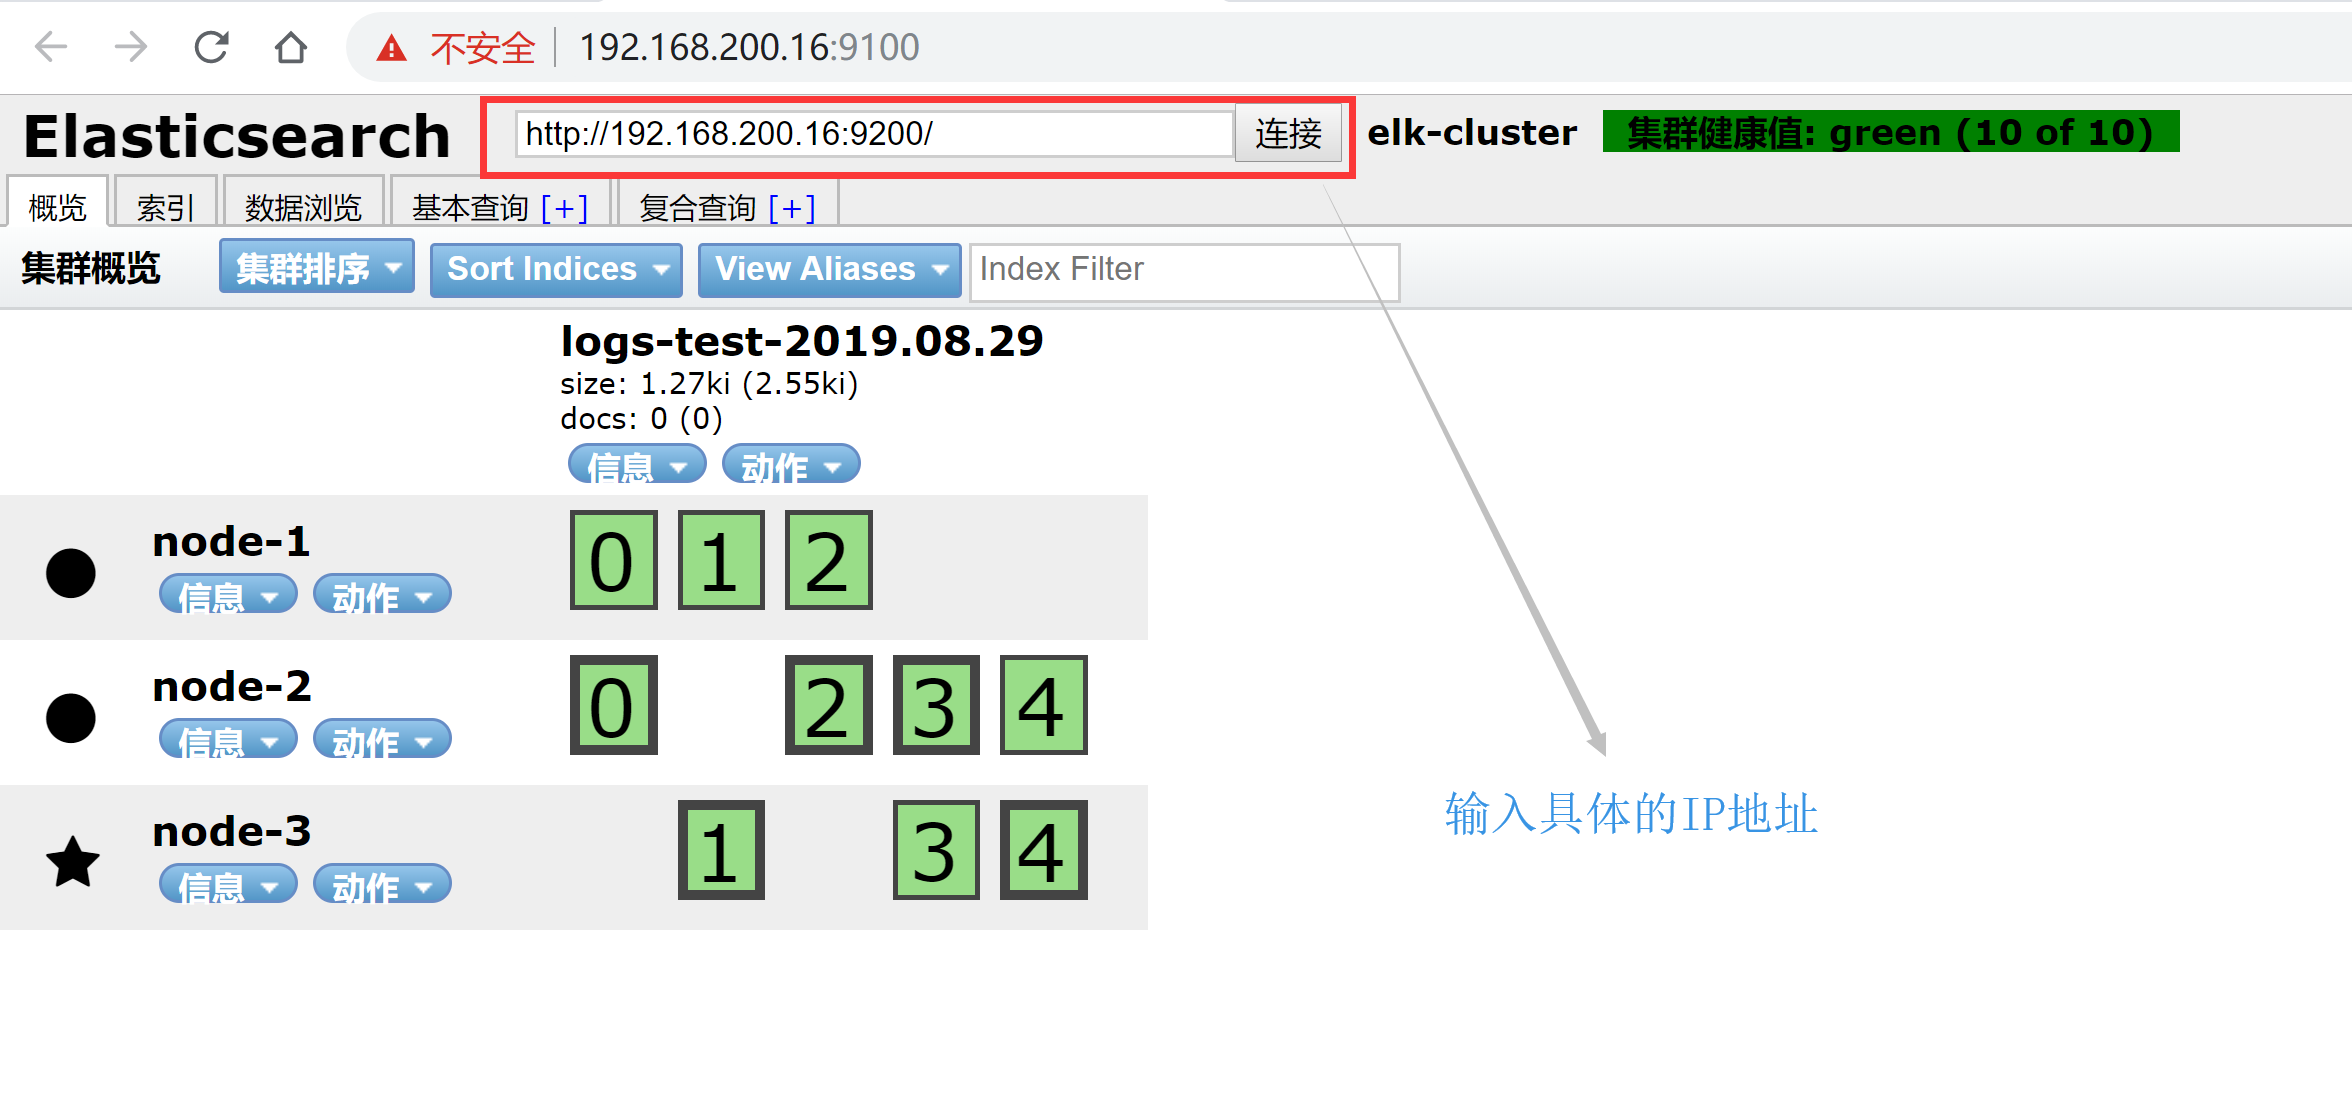
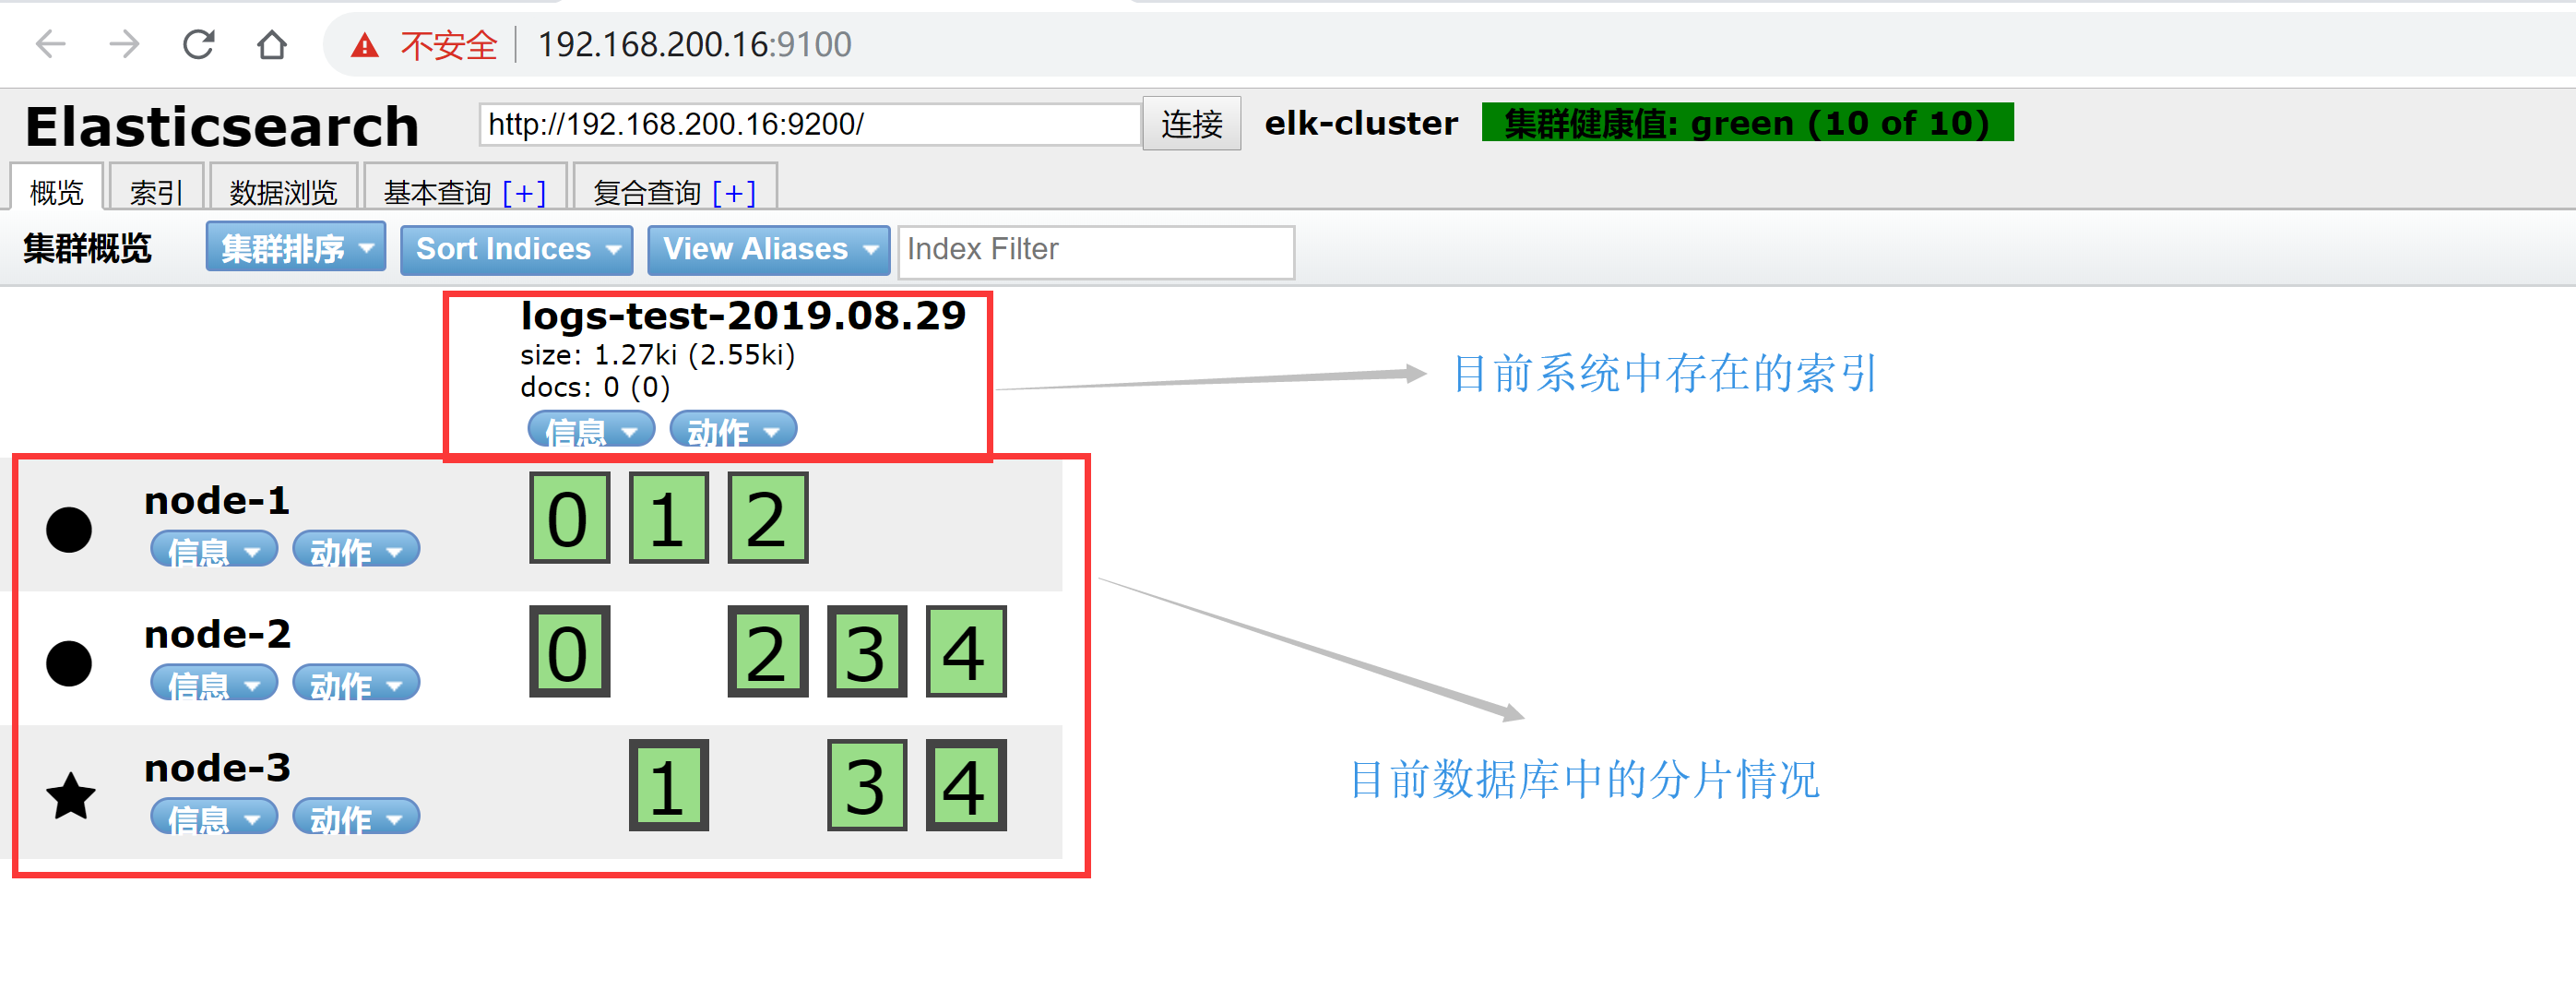
1.5.6 浏览器上再次访问http://192.168.200.16:9100
2. 企业级Logstash使用详解
2.1 Logstash安装与Input常用插件
2.1.1 Logstash-安装
#yum安装jdk1.8
[root@Logstash-Kibana ~]# yum -y install java-1.8.0-openjdk

[root@Logstash-Kibana ~]# vim /etc/yum.repos.d/elastic.repo
[root@Logstash-Kibana ~]# cat /etc/yum.repos.d/elastic.repo
[elastic-6.x]

name=Elastic repository for 6.x packages
baseurl=https://artifacts.elastic.co/packages/6.x/yum
gpgcheck=1
gpgkey=https://artifacts.elastic.co/GPG-KEY-elasticsearch
enabled=1
autorefresh=1
type=rpm-md

[root@Logstash-Kibana ~]# yum -y install logstash
2.1.2 Logstash-条件判断
- 比较操作符:
(1)相等:==,!=,<,>,<=,>=
(2)正则:=(正则匹配),!(不匹配正则)
(3)包含:in(包含),not in(不包含)- 布尔操作符:
(1)and(与)
(2)or(或)
(3)nand(非与)
1)xor(非或)- 一元运算符:
(1)!:取反
(2)():复合表达式
(3)!():对复合表达式取反
2.1.3 Logstash-Input之Stdin,File,Tcp,Beats插件
#(1)stdin示例
input {
  stdin{    #标准输入(用户交互输入数据)
  }
}
filter {   #条件过滤(抓取字段信息)
}
output {
  stdout {
    codec => rubydebug  #输出调试(调试配置文件语法用)
  }
}

#(2)File示例
input {
  file {
    path => "/var/log/messages" #读取的文件路径
    tags => "123"           #标签
    type => "syslog"        #类型
  }
}
filter {   #条件过滤(抓取字段信息)
}
output {
  stdout {
    codec => rubydebug  #输出调试(调试配置文件语法用)
  }
}

#(3)TCP示例
input {
  tcp {
    port => 12345
    type => "nc"
  }
}
filter {   #条件过滤(抓取字段信息)
}
output {
  stdout {
    codec => rubydebug  #输出调试(调试配置文件语法用)
  }
}

#(4)Beats示例
input {
  beats {           #后便会专门讲,此处不演示
    port => 5044
  }
}
filter {   #条件过滤(抓取字段信息)
}
output {
  stdout {
    codec => rubydebug  #输出调试(调试配置文件语法用)
  }
}
(1)input ==> stdin{}标准输入插件测试
#创建logstash配置文件
[root@Logstash-Kibana ~]# vim /etc/logstash/conf.d/test.conf
[root@Logstash-Kibana ~]# cat /etc/logstash/conf.d/test.conf
input {
    stdin{
     }
 }
filter {
 }
output {
  stdout {
     codec => rubydebug
     }
}
#测试logstash配置文件是否正确
[root@Logstash-Kibana ~]# /usr/share/logstash/bin/logstash -f /etc/logstash/conf.d/test.conf -t
OpenJDK 64-Bit Server VM warning: If the number of processors is expected to increase from one, then you should configure the number of parallel GC threads appropriately using -XX:ParallelGCThreads=N
WARNING: Could not find logstash.yml which is typically located in $LS_HOME/config or /etc/logstash. You can specify the path using --path.settings. Continuing using the defaults
Could not find log4j2 configuration at path /usr/share/logstash/config/log4j2.properties. Using default config which logs errors to the console
[INFO ] 2019-09-04 14:58:15.396 [main] writabledirectory - Creating directory {:setting=>"path.queue", :path=>"/usr/share/logstash/data/queue"}
[INFO ] 2019-09-04 14:58:15.435 [main] writabledirectory - Creating directory {:setting=>"path.dead_letter_queue", :path=>"/usr/share/logstash/data/dead_letter_queue"}
[WARN ] 2019-09-04 14:58:16.016 [LogStash::Runner] multilocal - Ignoring the 'pipelines.yml' file because modules or command line options are specified
Configuration OK      #配置文件正确
[INFO ] 2019-09-04 14:58:22.750 [LogStash::Runner] runner - Using config.test_and_exit mode. Config Validation Result: OK. Exiting Logstash
#启动Logstash进行测试
[root@Logstash-Kibana ~]# /usr/share/logstash/bin/logstash -f /etc/logstash/conf.d/test.conf
#以上省略若干。。。
yangwenbo     #这就是用户输入的数据
/usr/share/logstash/vendor/bundle/jruby/2.5.0/gems/awesome_print-1.7.0/lib/awesome_print/formatters/base_formatter.rb:31: warning: constant ::Fixnum is deprecated
{
       "message" => "yangwenbo",
      "@version" => "1",
          "host" => "Logstash-Kibana",
    "@timestamp" => 2019-09-04T07:03:18.814Z
}
12345         #这就是用户输入的数据
{
       "message" => "12345",
      "@version" => "1",
          "host" => "Logstash-Kibana",
    "@timestamp" => 2019-09-04T07:03:28.797Z
}
特别提示:
让用户直接输入数据的方式就是标准输入stdin{};
将输入的数据存储到message以后直接输出到屏幕上进行调试就是标准输出stdout{codec => rubydebug}
(2)input ==> file{}读取文件数据
#修改Logstash配置文件
[root@Logstash-Kibana ~]# vim /etc/logstash/conf.d/test.conf
[root@Logstash-Kibana ~]# cat /etc/logstash/conf.d/test.conf
input {
  file {
       path => "/var/log/messages"
       tags => "123"
       type => "syslog"
     }
 }
filter {
 }
output {
   stdout {
      codec => rubydebug
     }
 }
#启动Logstash
[root@Logstash-Kibana ~]# /usr/share/logstash/bin/logstash -f /etc/logstash/conf.d/test.conf
#以下省略若干。。。
#再开一个窗口向日志文件输入一句话
[root@Logstash-Kibana ~]# echo "yunwei" >> /var/log/messages
#回头再去查看logstash的debug输出
{
          "type" => "syslog",
      "@version" => "1",
          "path" => "/var/log/messages",
          "tags" => [
        [0] "123"
    ],
    "@timestamp" => 2019-09-04T07:26:29.726Z,
          "host" => "Logstash-Kibana",
       "message" => "yunwei"
}
(3)input ==> tcp{}通过监听tcp端口接收日志
#修改logstash配置文件
[root@Logstash-Kibana ~]# vim /etc/logstash/conf.d/test.conf
[root@Logstash-Kibana ~]# cat /etc/logstash/conf.d/test.conf
input {
  tcp {
     port => 12345
     type => "nc"
   }
}
filter {
}
output {
   stdout {
     codec => rubydebug
    }
}
#启动Logstash
[root@Logstash-Kibana ~]# /usr/share/logstash/bin/logstash -f /etc/logstash/conf.d/test.conf
#以下省略若干。。。
#再开一个窗口,查看12345端口监听情况
[root@Logstash-Kibana ~]# netstat -antup | grep 12345
tcp6       0      0 :::12345                :::*                    LISTEN      8538/java
#在ES1上安装nc向12345端口传输数据
[root@ES1 ~]# yum -y install nc
[root@ES1 ~]# echo "welcome to yangwenbo" | nc 192.168.200.19 12345
#回头再去查看logstash的debug输出
{
          "host" => "192.168.200.16",
          "port" => 37944,
    "@timestamp" => 2019-09-04T09:41:11.396Z,
          "type" => "nc",
      "@version" => "1",
       "message" => "welcome to yangwenbo"
}
2.1.4 更多Input插件的用户请查看官网链接
https://www.elastic.co/guide/en/logstash/current/plugins-inputs-file.html
2.2 Logstash-Input(Output)之Codec插件
#Json/Json_lines示例
input {
  stdin {
    codec => json {     #将json格式的数据转码成UTF-8格式后进行输入
      charset => ["UTF-8"]
    }
  }
}
filter {
}
output {
  stdout {
    codec => rubydebug
  }
}
codec => json {}将json格式数据进行编码转换
#修改logstash配置文件
[root@Logstash-Kibana ~]# vim /etc/logstash/conf.d/test.conf
[root@Logstash-Kibana ~]# cat /etc/logstash/conf.d/test.conf
input {
  stdin {
     codec => json {
        charset => ["UTF-8"]
      }
   }
}
filter {
}
output {
   stdout {
      codec => rubydebug
   }
}
#启动Logstash
[root@Logstash-Kibana ~]# /usr/share/logstash/bin/logstash -f /etc/logstash/conf.d/test.conf
#以下省略若干。。。
#再开一个窗口进入python交互界面生成json格式数据
[root@Logstash-Kibana ~]# python
Python 2.7.5 (default, Apr  9 2019, 14:30:50)
[GCC 4.8.5 20150623 (Red Hat 4.8.5-36)] on linux2
Type "help", "copyright", "credits" or "license" for more information.
>>> import json
>>> data = [{'a':1,'b':2,'c':3,'d':4,'e':5}]
>>> json = json.dumps(data)
>>> print json
[{"a": 1, "c": 3, "b": 2, "e": 5, "d": 4}]    #这就是json格式数据
#将json格式数据,输入后,查看logstash数据的输出结果
{
             "d" => 4,
             "e" => 5,
          "host" => "Logstash-Kibana",
             "a" => 1,
             "c" => 3,
             "b" => 2,
      "@version" => "1",
    "@timestamp" => 2019-09-04T11:29:12.044Z
}
2.3 Logstash-Filter之Json,Kv插件
#Json示例
input {
  stdin {
  }
}
filter {
  json {
    source => "message" #将保存在message中的json数据进行结构化解析
    target => "content" #解析后的结果保存在content里
  }
}
output {
  stdout {
    codec => rubydebug
  }
}

#Kv示例
filter {
  kv {
    field_split => "&?"     #将输入的数据按&字符进行切割解析
  }
}
(1)filter => json {}将json的编码进行结构化解析过滤
#修改logstash配置文件
[root@Logstash-Kibana ~]# vim /etc/logstash/conf.d/test.conf
[root@Logstash-Kibana ~]# cat /etc/logstash/conf.d/test.conf
input {
  stdin {
   }
}
filter {
}
output {
   stdout {
     codec => rubydebug
   }
}
#启动Logstash
[root@Logstash-Kibana ~]# /usr/share/logstash/bin/logstash -f /etc/logstash/conf.d/test.conf
#以下省略若干。。。
#交互式输入json格式数据:{"a": 1, "c": 3, "b": 2, "e": 5, "d": 4}
{
       "message" => "{"a": 1, "c": 3, "b": 2, "e": 5, "d": 4}",    #数据都保存在了message字段里
          "host" => "Logstash-Kibana",
      "@version" => "1",
    "@timestamp" => 2019-09-05T06:15:17.723Z
}
#再次修改logstash配置文件
[root@Logstash-Kibana ~]# vim /etc/logstash/conf.d/test.conf
[root@Logstash-Kibana ~]# cat /etc/logstash/conf.d/test.conf
input {
   stdin {
   }
}
filter {
   json {
      source => "message"
      target => "content"
    }
}
output {
   stdout {
      codec => rubydebug
   }
}
#启动Logstash
[root@Logstash-Kibana ~]# /usr/share/logstash/bin/logstash -f /etc/logstash/conf.d/test.conf
#以下省略若干。。。
#交互式输入以下内容进行解析:{"a": 1, "c": 3, "b": 2, "e": 5, "d": 4}
{
    "@timestamp" => 2019-09-05T06:24:59.352Z,
       "content" => {     #json被结构化解析出来了
        "d" => 4,
        "e" => 5,
        "a" => 1,
        "c" => 3,
        "b" => 2
    },
          "host" => "Logstash-Kibana",
      "@version" => "1",
       "message" => "{"a": 1, "c": 3, "b": 2, "e": 5, "d": 4}"
}
(2)filter => kv {}将输入的数据按照制定符号切割
#修改logstash配置文件
[root@Logstash-Kibana ~]# vim /etc/logstash/conf.d/test.conf
[root@Logstash-Kibana ~]# cat /etc/logstash/conf.d/test.conf
input {
   stdin {
   }
}
filter {
    kv {
       field_split => "&?"
    }
}
output {
    stdout {
      codec => rubydebug
    }
}
#启动Logstash
[root@Logstash-Kibana ~]# /usr/share/logstash/bin/logstash -f /etc/logstash/conf.d/test.conf
#以下省略若干。。。
#交互式输入以下数据,然后查看解析结果:name=yangwenbo&yunjisuan=benet&yunwei=666
{
    "@timestamp" => 2019-09-05T06:32:01.093Z,
        "yunwei" => "666",
          "name" => "yangwenbo",
       "message" => "name=yangwenbo&yunjisuan=benet&yunwei=666",
     "yunjisuan" => "benet",
      "@version" => "1",
          "host" => "Logstash-Kibana"
}
2.4 Logstash-Filter之Grok插件
2.4.1 grok自定义正则的数据抓取模式
#日志输入示例:
223.72.85.86 GET /index.html 15824 200

#grok自定义正则的数据抓取示例
input {
  stdin {
  }
}
filter {
  grok {
    match => {
      "message" => '(?<client>[0-9.]+)[ ]+(?<method>[A-Z]+)[ ]+(?<request>[a-zA-Z/.]+)[ ]+(?<bytes>[0-9]+)[ ]+(?<num>[0-9]+)'
    }
  }
}
output {
  stdout {
    codec => rubydebug
  }
}
操作演示
#修改logstash配置文件
[root@Logstash-Kibana ~]# vim /etc/logstash/conf.d/test.conf
[root@Logstash-Kibana ~]# cat /etc/logstash/conf.d/test.conf
input {
   stdin {
    }
}
filter {
    grok {
       match => {
           "message" => '(?<client>[0-9.]+)[ ]+(?<method>[A-Z]+)[ ]+(?<request>[a-zA-Z/.]+)[ ]+(?<bytes>[0-9]+)[ ]+(?<num>[0-9]+)'
        }
    }
}
output {
   stdout {
     codec => rubydebug
    }
}
#启动Logstash
[root@Logstash-Kibana ~]# /usr/share/logstash/bin/logstash -f /etc/logstash/conf.d/test.conf
#以下省略若干。。。
#输入日志进行数据抓取测试:223.72.85.86 GET /index.html 15824 200
{
      "@version" => "1",
       "request" => "/index.html",
       "message" => "223.72.85.86 GET /index.html 15824 200",
        "method" => "GET",
         "bytes" => "15824",
          "host" => "Logstash-Kibana",
           "num" => "200",
    "@timestamp" => 2019-09-05T06:41:49.878Z,
        "client" => "223.72.85.86"
}
2.4.2 grok内置正则的数据抓取模式
为了方便用户抓取数据方便,官方自定义了一些内置正则的默认抓取方式
Grok默认的内置正则模式,官方网页示例
https://github.com/logstash-plugins/logstash-patterns-core/blob/master/patterns/grok-patterns
#logstash默认挂载的常用的内置正则库文件
[root@Logstash-Kibana ~]# rpm -ql logstash | grep grok-patterns
/usr/share/logstash/vendor/bundle/jruby/2.5.0/gems/logstash-patterns-core-4.1.2/patterns/grok-patterns
[root@Logstash-Kibana ~]# cat /usr/share/logstash/vendor/bundle/jruby/2.5.0/gems/logstash-patterns-core-4.1.2/patterns/grok-patterns
#以下省略无数条。。。
操作演示
#日志输入示例:223.72.85.86 GET /index.html 15824 200
#修改logstash配置文件
[root@Logstash-Kibana ~]# vim /etc/logstash/conf.d/test.conf
[root@Logstash-Kibana ~]# cat /etc/logstash/conf.d/test.conf
input {
   stdin {
    }
}
filter {
   grok {
      match => {
          "message" => "%{IP:client} %{WORD:method} %{URIPATHPARAM:request} %{NUMBER:bytes} %{NUMBER:num}"
        }
    }
}
output {
    stdout {
       codec => rubydebug
    }
}
#启动Logstash
[root@Logstash-Kibana ~]# /usr/share/logstash/bin/logstash -f /etc/logstash/conf.d/test.conf
#以下省略若干。。。
#输入日志进行数据抓取测试:223.72.85.86 GET /index.html 15824 200
{
        "client" => "223.72.85.86",
    "@timestamp" => 2019-09-05T06:55:31.459Z,
           "num" => "200",
          "host" => "Logstash-Kibana",
       "request" => "/index.html",
       "message" => "223.72.85.86 GET /index.html 15824 200",
      "@version" => "1",
        "method" => "GET",
         "bytes" => "15824"
}
2.4.3 grok自定义内置正则的数据抓取模式
#日志输入示例(新增一个数据):223.72.85.86 GET /index.html 15824 200 "welcome to yangwenbo"
#修改logstash配置文件
[root@Logstash-Kibana ~]# vim /etc/logstash/conf.d/test.conf
[root@Logstash-Kibana ~]# cat /etc/logstash/conf.d/test.conf
input {
   stdin {
   }
}
filter {
   grok {
      patterns_dir => "/opt/patterns"     #自定义的内置正则抓取模板路径
      match => {
        "message" => '%{IP:client} %{WORD:method} %{URIPATHPARAM:request} %{NUMBER:bytes} %{NUMBER:num} "%{STRING:content}"'
        }
    }
}
output {
    stdout {
      codec => rubydebug
    }
}
#创建自定义内置正则的挂载模板文件
[root@Logstash-Kibana ~]# vim /opt/patterns
[root@Logstash-Kibana ~]# cat /opt/patterns
STRING .*
#启动Logstash
[root@Logstash-Kibana ~]# /usr/share/logstash/bin/logstash -f /etc/logstash/conf.d/test.conf
#以下省略若干。。。
#输入日志示例,查看数据抓取结果:223.72.85.86 GET /index.html 15824 200 "welcome to yangwenbo"
{
       "request" => "/index.html",
       "message" => "223.72.85.86 GET /index.html 15824 200 "welcome to yangwenbo"",
    "@timestamp" => 2019-09-05T07:25:23.949Z,
        "method" => "GET",
         "bytes" => "15824",
       "content" => "welcome to yangwenbo",
          "host" => "Logstash-Kibana",
           "num" => "200",
        "client" => "223.72.85.86",
      "@version" => "1"
}
2.4.4 grok多模式匹配的数据抓取
有的时候,我们可能需要抓取多种日志格式的数据
因此,我们需要配置grok的多模式匹配的数据抓取
#日志输入示例:
223.72.85.86 GET /index.html 15824 200 "welcome to yangwenbo"
223.72.85.86 GET /index.html 15824 200 《Mr.yang-2019-09-05》
#修改logstash配置文件
[root@Logstash-Kibana ~]# vim /etc/logstash/conf.d/test.conf
[root@Logstash-Kibana ~]# cat /etc/logstash/conf.d/test.conf
input {
   stdin {
   }
}
filter {
   grok {
      patterns_dir => "/opt/patterns"
      match => [
         "message",'%{IP:client} %{WORD:method} %{URIPATHPARAM:request} %{NUMBER:bytes} %{NUMBER:num} "%{STRING:content}"',
         "message",'%{IP:client} %{WORD:method} %{URIPATHPARAM:request} %{NUMBER:bytes} %{NUMBER:num} 《%{NAME:name}》'
          ]
     }
}
output {
    stdout {
        codec => rubydebug
    }
}
#增加一个自定义的内置正则抓取变量
[root@Logstash-Kibana ~]# vim /opt/patterns
[root@Logstash-Kibana ~]# cat /opt/patterns
STRING .*
NAME .*
#启动Logstash
[root@Logstash-Kibana ~]# /usr/share/logstash/bin/logstash -f /etc/logstash/conf.d/test.conf
#以下省略若干。。。
#输入日志示例,查看数据抓取结果
{
         "bytes" => "15824",
    "@timestamp" => 2019-09-05T07:51:29.505Z,
      "@version" => "1",
       "content" => "welcome to yangwenbo",
           "num" => "200",
       "message" => "223.72.85.86 GET /index.html 15824 200 "welcome to yangwenbo"",
          "host" => "Logstash-Kibana",
        "client" => "223.72.85.86",
       "request" => "/index.html",
        "method" => "GET"
}

-----------------------------------------------------------------------------

{
         "bytes" => "15824",
    "@timestamp" => 2019-09-05T07:51:38.083Z,
      "@version" => "1",
           "num" => "200",
       "message" => "223.72.85.86 GET /index.html 15824 200 《Mr.yang-2019-09-05》",
          "name" => "Mr.yang-2019-09-05",
          "host" => "Logstash-Kibana",
        "client" => "223.72.85.86",
       "request" => "/index.html",
        "method" => "GET"
}
2.5 Logstash-Filter之geoip插件
geoip插件可以对IP的来源进行分析,并通过Kibana的地图功能形象的显示出来。
#日志输入示例
223.72.85.86 GET /index.html 15824 200 "welcome to yangwenbo"
119.147.146.189 GET /index.html 15824 200 《Mr.yang-2019-09-05》
#修改logstash配置文件
[root@Logstash-Kibana ~]# vim /etc/logstash/conf.d/test.conf
[root@Logstash-Kibana ~]# cat /etc/logstash/conf.d/test.conf
input {
   stdin {
   }
}
filter {
   grok {
     patterns_dir => "/opt/patterns"
     match => [
        "message",'%{IP:client} %{WORD:method} %{URIPATHPARAM:request} %{NUMBER:bytes} %{NUMBER:num} "%{STRING:content}"',
        "message",'%{IP:client} %{WORD:method} %{URIPATHPARAM:request} %{NUMBER:bytes} %{NUMBER:num} 《%{NAME:name}》'
         ]
    }
    geoip {
       source => "client"
       database => "/opt/GeoLite2-City.mmdb"
    }
}
output {
    stdout {
       codec => rubydebug
    }
}
#下载geoip插件包
[root@Logstash-Kibana ~]# wget http://geolite.maxmind.com/download/geoip/database/GeoLite2-City.tar.gz
[root@Logstash-Kibana ~]# ll -d GeoLite2-City.tar.gz
-rw-r--r-- 1 root root 30044666 9月   4 19:40 GeoLite2-City.tar.gz

#解压安装geoip插件包
[root@Logstash-Kibana ~]# tar xf GeoLite2-City.tar.gz
[root@Logstash-Kibana ~]# cd GeoLite2-City_20190903/
[root@Logstash-Kibana ~]# cp GeoLite2-City_20190903/GeoLite2-City.mmdb /opt/
#启动Logstash
[root@Logstash-Kibana ~]# /usr/share/logstash/bin/logstash -f /etc/logstash/conf.d/test.conf
#以下省略若干。。。
#输入日志示例,查看数据抓取结果
223.72.85.86 GET /index.html 15824 200 "welcome to yangwenbo"
{
    "@timestamp" => 2019-09-05T08:29:35.399Z,
       "content" => "welcome to yangwenbo",
         "geoip" => {
           "region_code" => "BJ",
         "country_code3" => "CN",      #IP所在国家
              "timezone" => "Asia/Shanghai",
         "country_code2" => "CN",
                    "ip" => "223.72.85.86",
        "continent_code" => "AS",
              "location" => {
            "lon" => 116.3889,     #IP所在地图经度
            "lat" => 39.9288       #IP所在地图纬度
        },
              "latitude" => 39.9288,
          "country_name" => "China",
           "region_name" => "Beijing",
             "city_name" => "Beijing",     #IP所在城市
             "longitude" => 116.3889
    },
       "message" => "223.72.85.86 GET /index.html 15824 200 "welcome to yangwenbo"",
       "request" => "/index.html",
         "bytes" => "15824",
           "num" => "200",
      "@version" => "1",
          "host" => "Logstash-Kibana",
        "client" => "223.72.85.86",
        "method" => "GET"
}

-----------------------------------------------------------------------------
119.147.146.189 GET /index.html 15824 200 《Mr.yang-2019-09-05》
{
    "@timestamp" => 2019-09-05T08:33:42.454Z,
          "name" => "Mr.yang-2019-09-05",
         "geoip" => {
           "region_code" => "GD",
         "country_code3" => "CN",
              "timezone" => "Asia/Shanghai",
         "country_code2" => "CN",
                    "ip" => "119.147.146.189",
        "continent_code" => "AS",
              "location" => {
            "lon" => 113.25,
            "lat" => 23.1167
        },
              "latitude" => 23.1167,
          "country_name" => "China",
           "region_name" => "Guangdong",
             "longitude" => 113.25
    },
       "message" => "119.147.146.189 GET /index.html 15824 200 《Mr.yang-2019-09-05》",
       "request" => "/index.html",
         "bytes" => "15824",
           "num" => "200",
      "@version" => "1",
          "host" => "Logstash-Kibana",
        "client" => "119.147.146.189",
        "method" => "GET"
}
2.6 Logstash-输出(Output)插件
#ES示例

output {
  elasticsearch {
    hosts => "localhost:9200"     #将数据写入elasticsearch
    index => "logstash-mr_chen-admin-%{+YYYY.MM.dd}"      #索引为xxx
  }
}
3. 企业级Kibana使用详解
| 主机名 | 主机IP | 用途 |
|---|---|---|
| ES1 | 192.168.200.16 | elasticsearch-node1 |
| ES2 | 192.168.200.17 | elasticsearch-node2 |
| ES3 | 192.168.200.18 | elasticsearch-node3 |
| Logstash-Kibana | 192.168.200.19 | 日志可视化服务器 |
3.1 ELK Stack配置应用案例
#利用yum源安装kibana
[root@Logstash-Kibana ~]# yum -y install kibana
#修改logstash配置文件
[root@Logstash-Kibana ~]# vim /etc/logstash/conf.d/test.conf
[root@Logstash-Kibana ~]# cat /etc/logstash/conf.d/test.conf
input {
   file {
      path => ["/var/log/messages"]
      type => "system"                #对数据添加类型
      tags => ["syslog","test"]       #对数据添加标识
      start_position => "beginning"
   }
file {
      path => ["/var/log/audit/audit.log"]
      type => "system"                #对数据添加类型
      tags => ["auth","test"]         #对数据添加标识
      start_position => "beginning"
   }
}
filter {
   }
output {
    if [type] == "system" {
          if [tags][0] == "syslog" {      #通过判断可以将不同日志写到不同的索引里
                 elasticsearch {
                        hosts => ["http://192.168.200.16:9200","http://192.168.200.17:9200","http://192.168.200.18:9200"]
                        index => "logstash-mr_yang-syslog-%{+YYYY.MM.dd}"
              }
              stdout { codec => rubydebug }
          }
          else if [tags][0] == "auth" {
                 elasticsearch {
                        hosts => ["http://192.168.200.16:9200","http://192.168.200.17:9200","http://192.168.200.18:9200"]
                        index => "logstash-mr_yang-auth-%{+YYYY.MM.dd}"
              }
              stdout { codec => rubydebug }
           }
     }
}
#修改kibana的配置文件
#修改前
[root@Logstash-Kibana ~]# cat -n /etc/kibana/kibana.yml_bak | sed -n '7p;28p'
     7	#server.host: "localhost"
    28	#elasticsearch.hosts: ["http://localhost:9200"]

#修改后
[root@Logstash-Kibana ~]# cat -n /etc/kibana/kibana.yml | sed -n '7p;28p'
     7	server.host: "0.0.0.0"
    28	elasticsearch.hosts: ["http://192.168.200.16:9200"]     #就写一个ES主节点即可
#启动kibana进程
[root@Logstash-Kibana ~]# systemctl start kibana

#启动logstash
[root@Logstash-Kibana ~]# /usr/share/logstash/bin/logstash -f /etc/logstash/conf.d/test.conf
特别提示: 如果elasticsearch里没有任何索引,那么kibana是都取不到的 ,所以启动logstash先elasticsearch里写点数据就好了
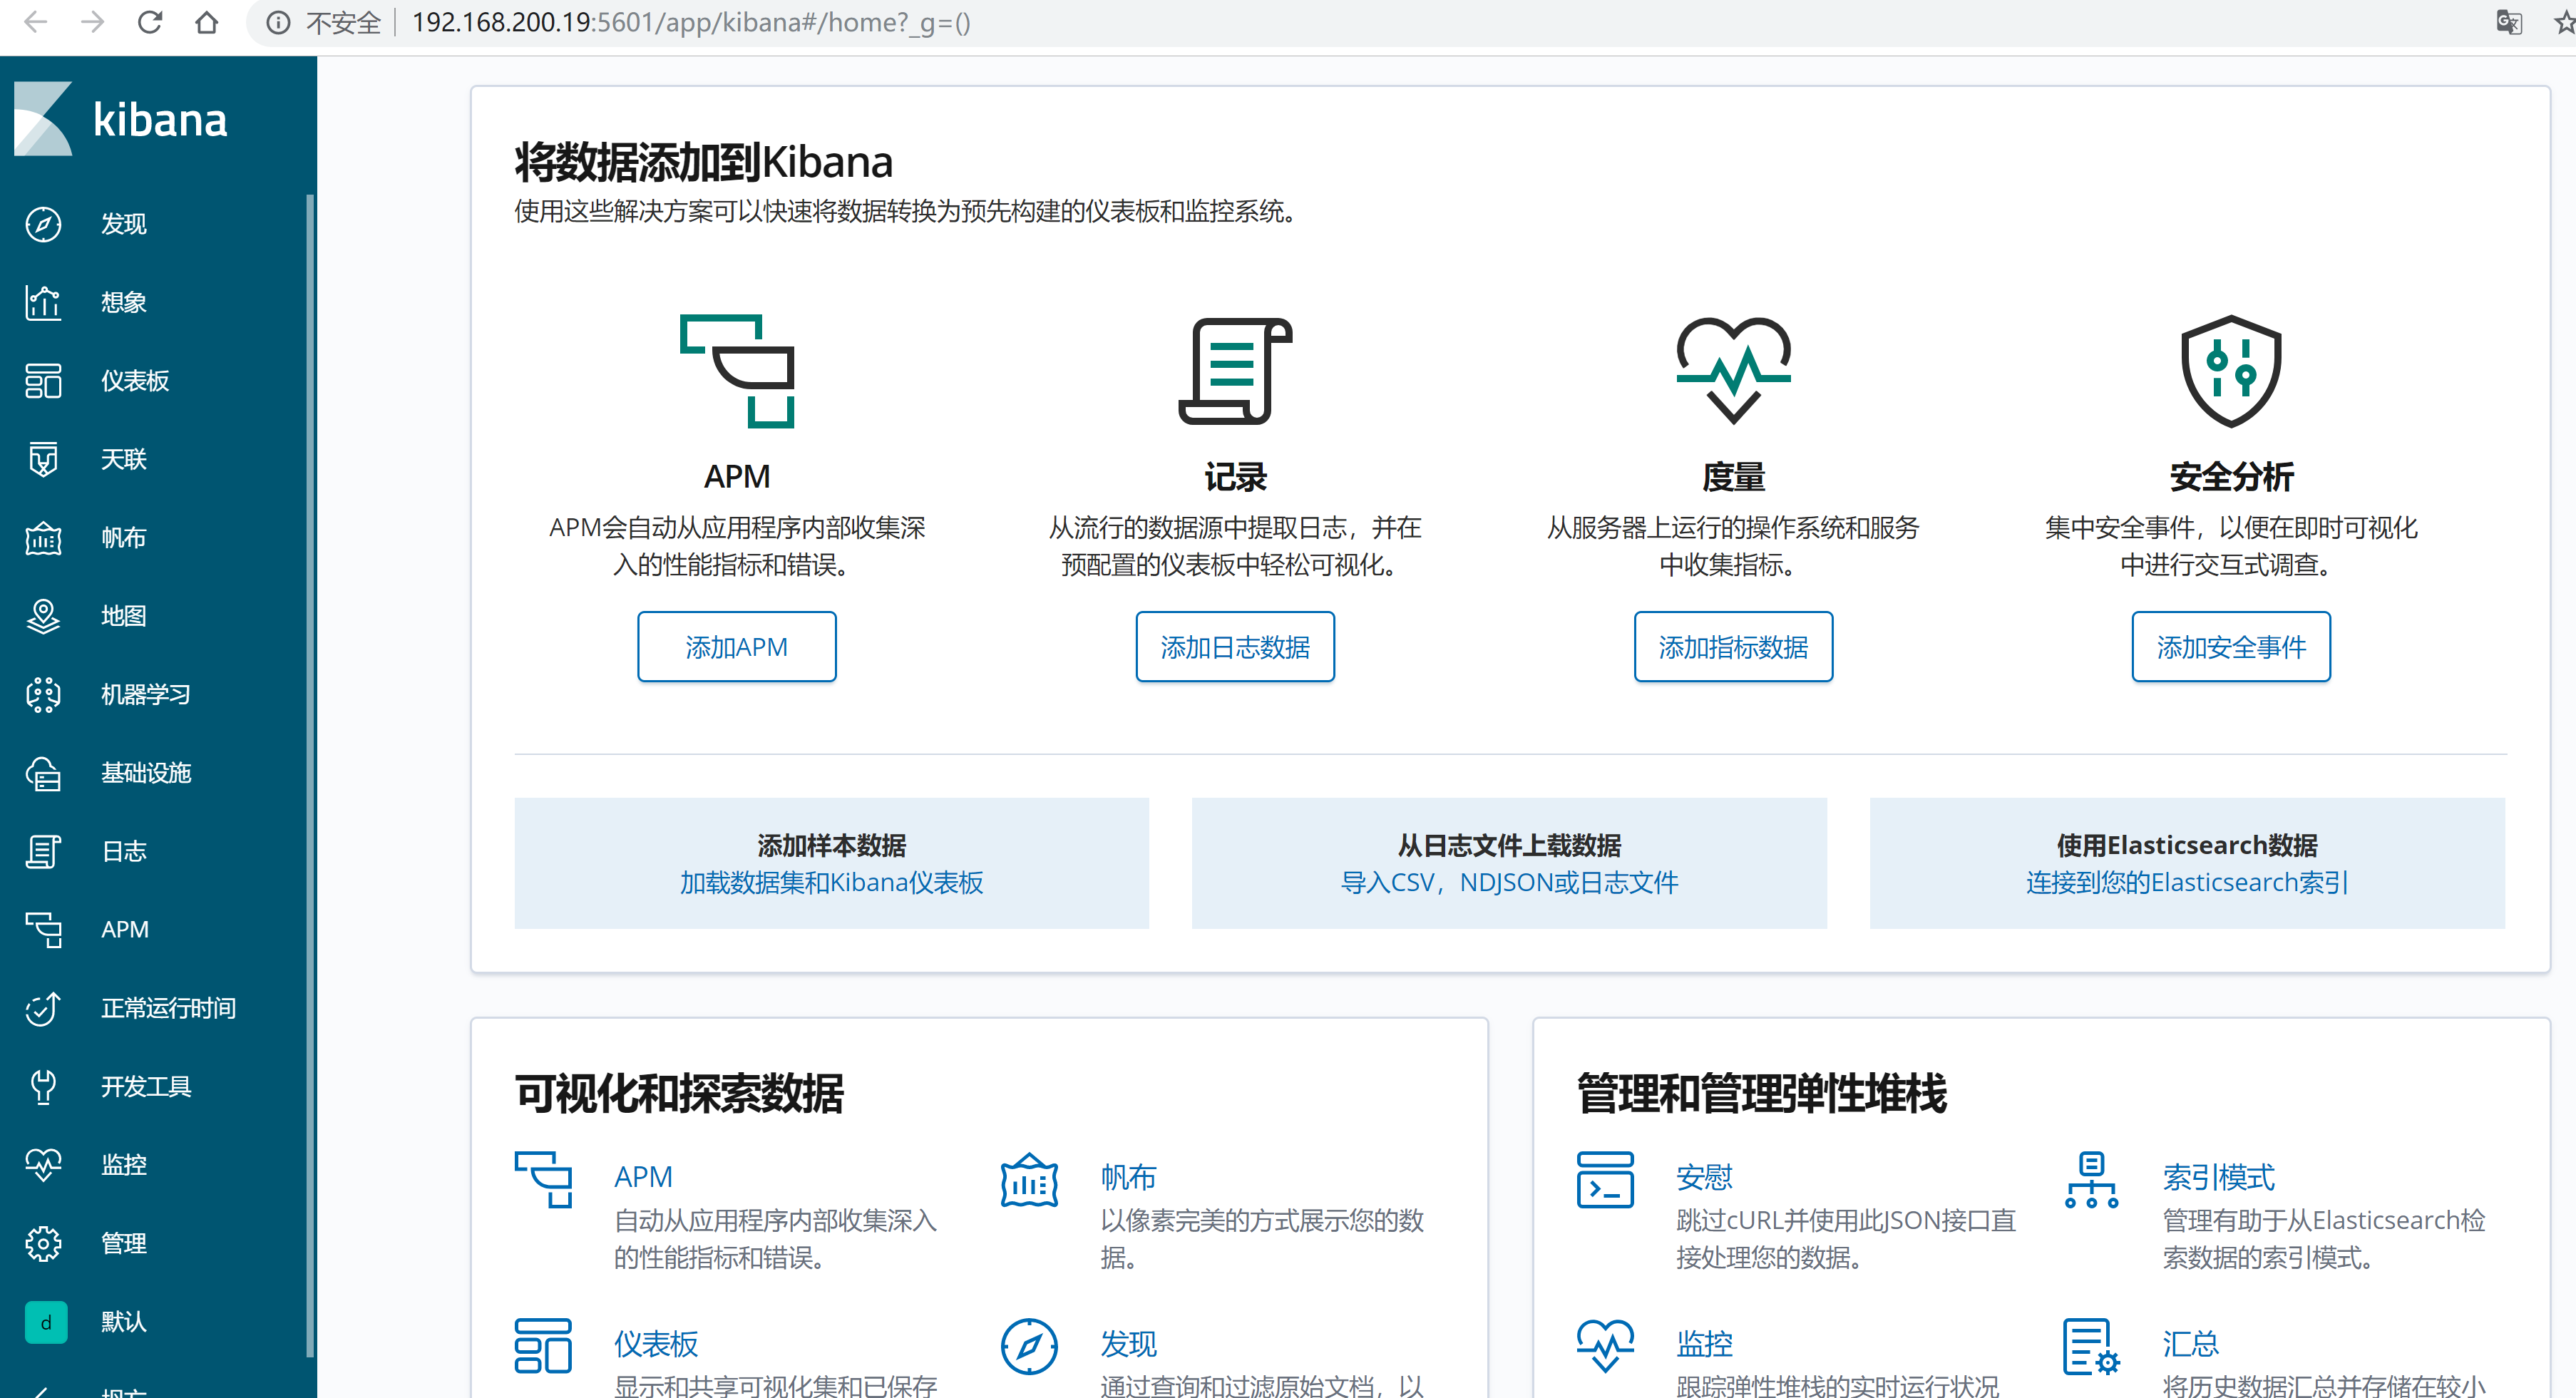
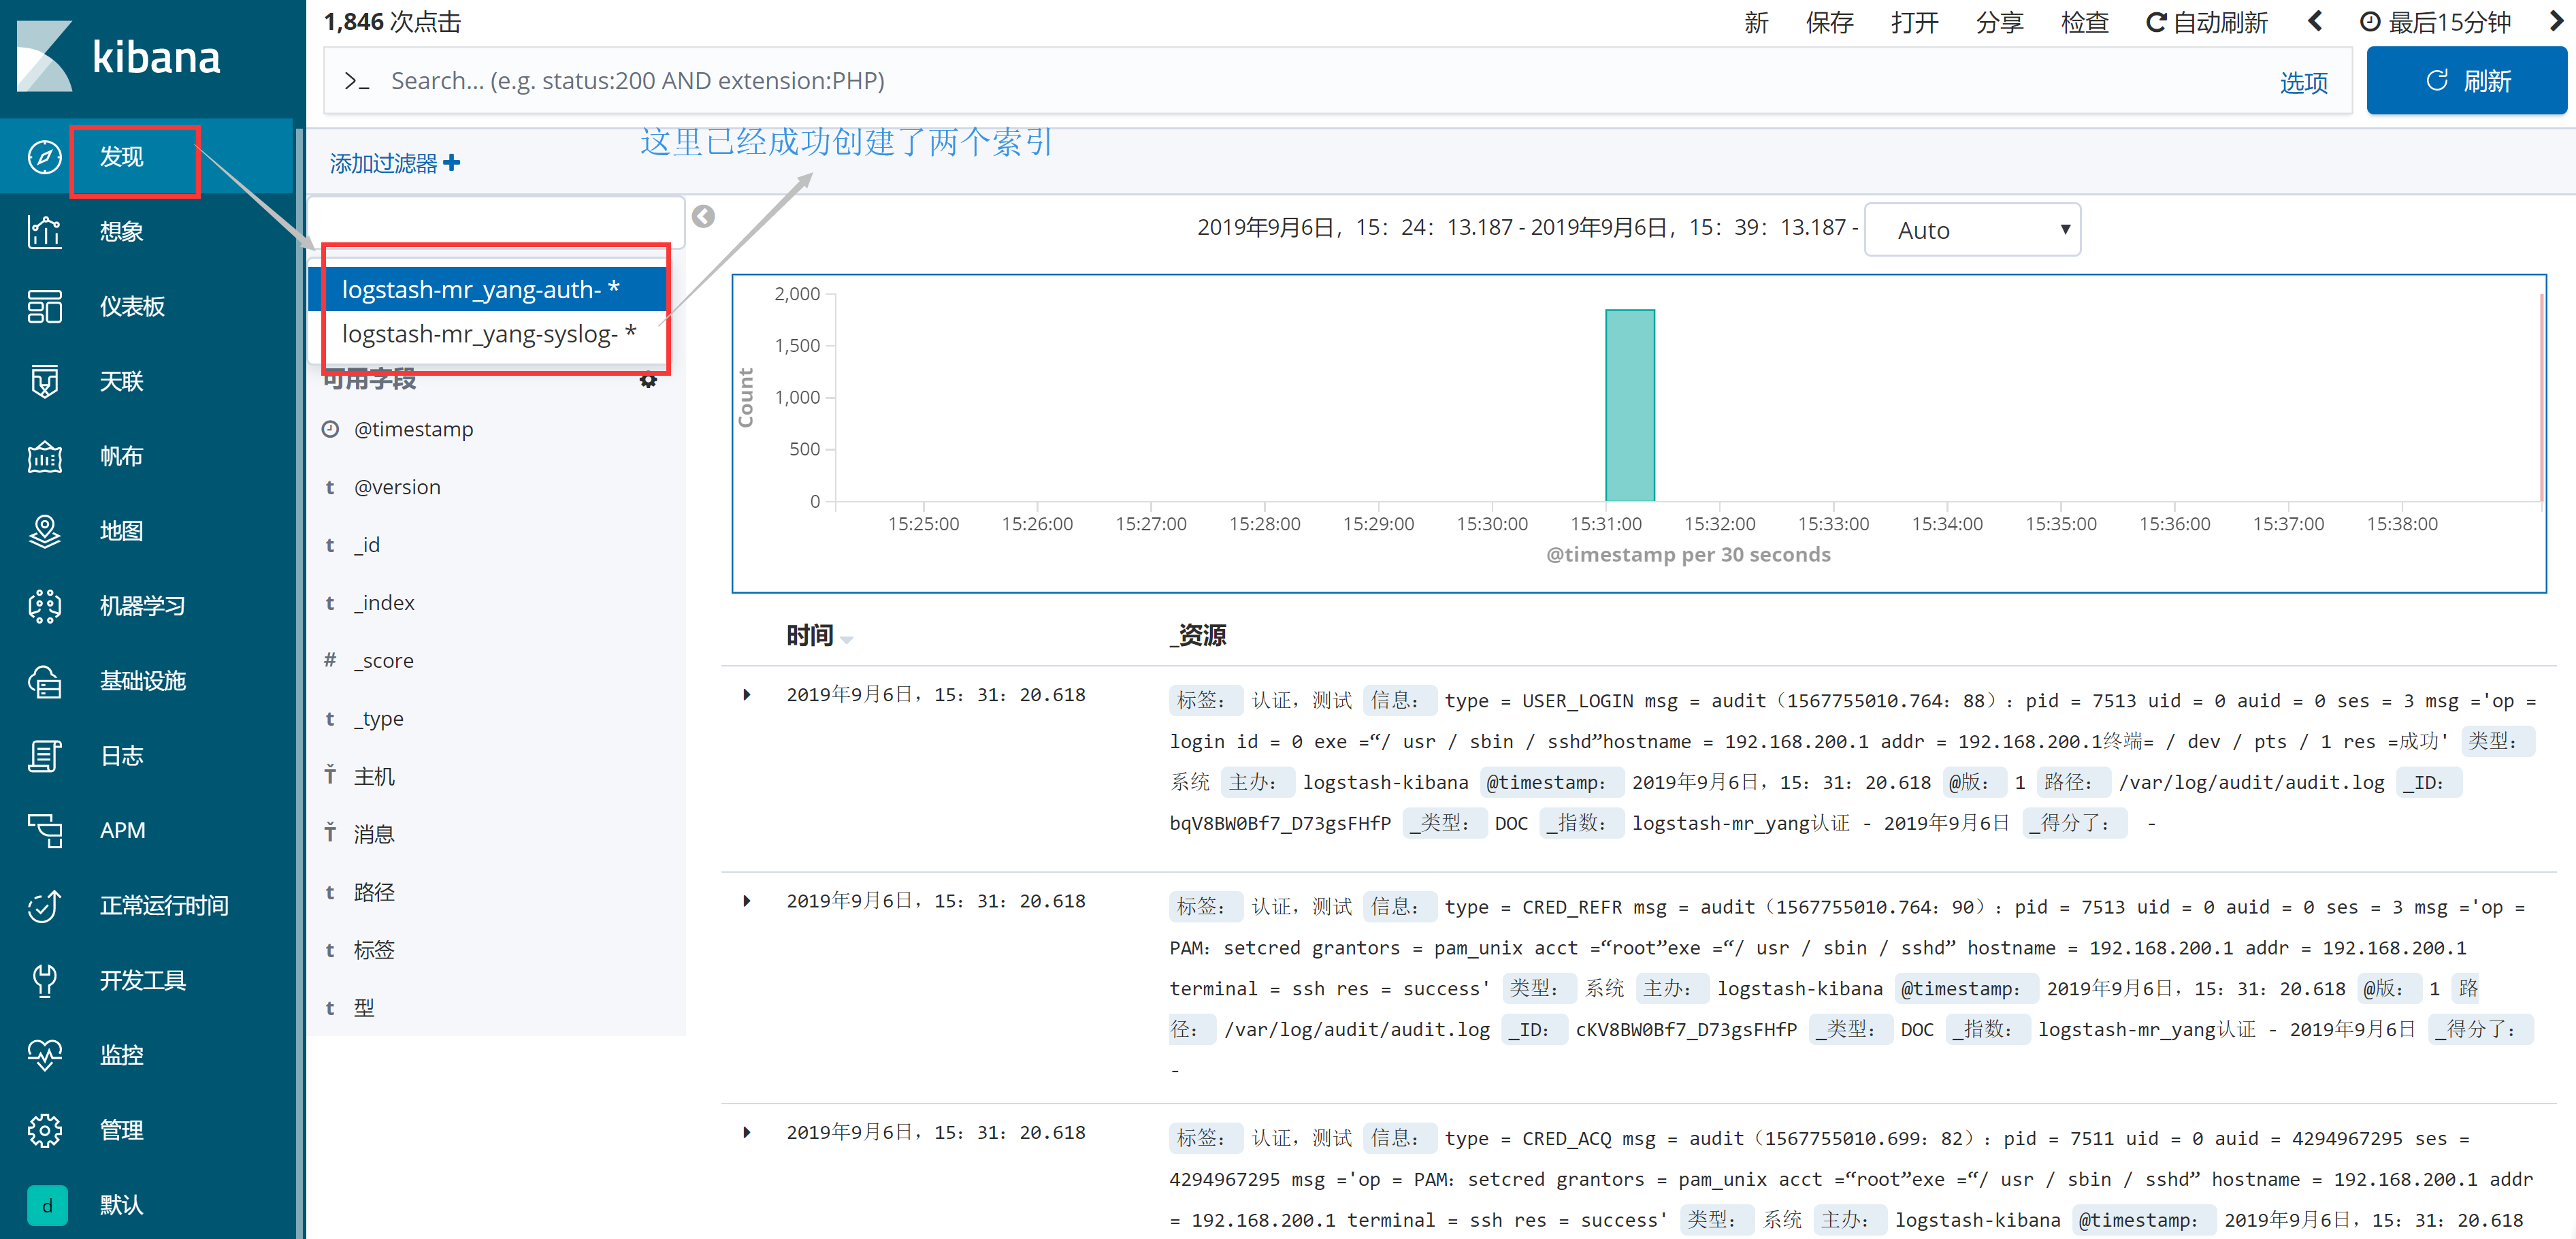
通过浏览器访问kibana http://192.168.200.19:5601
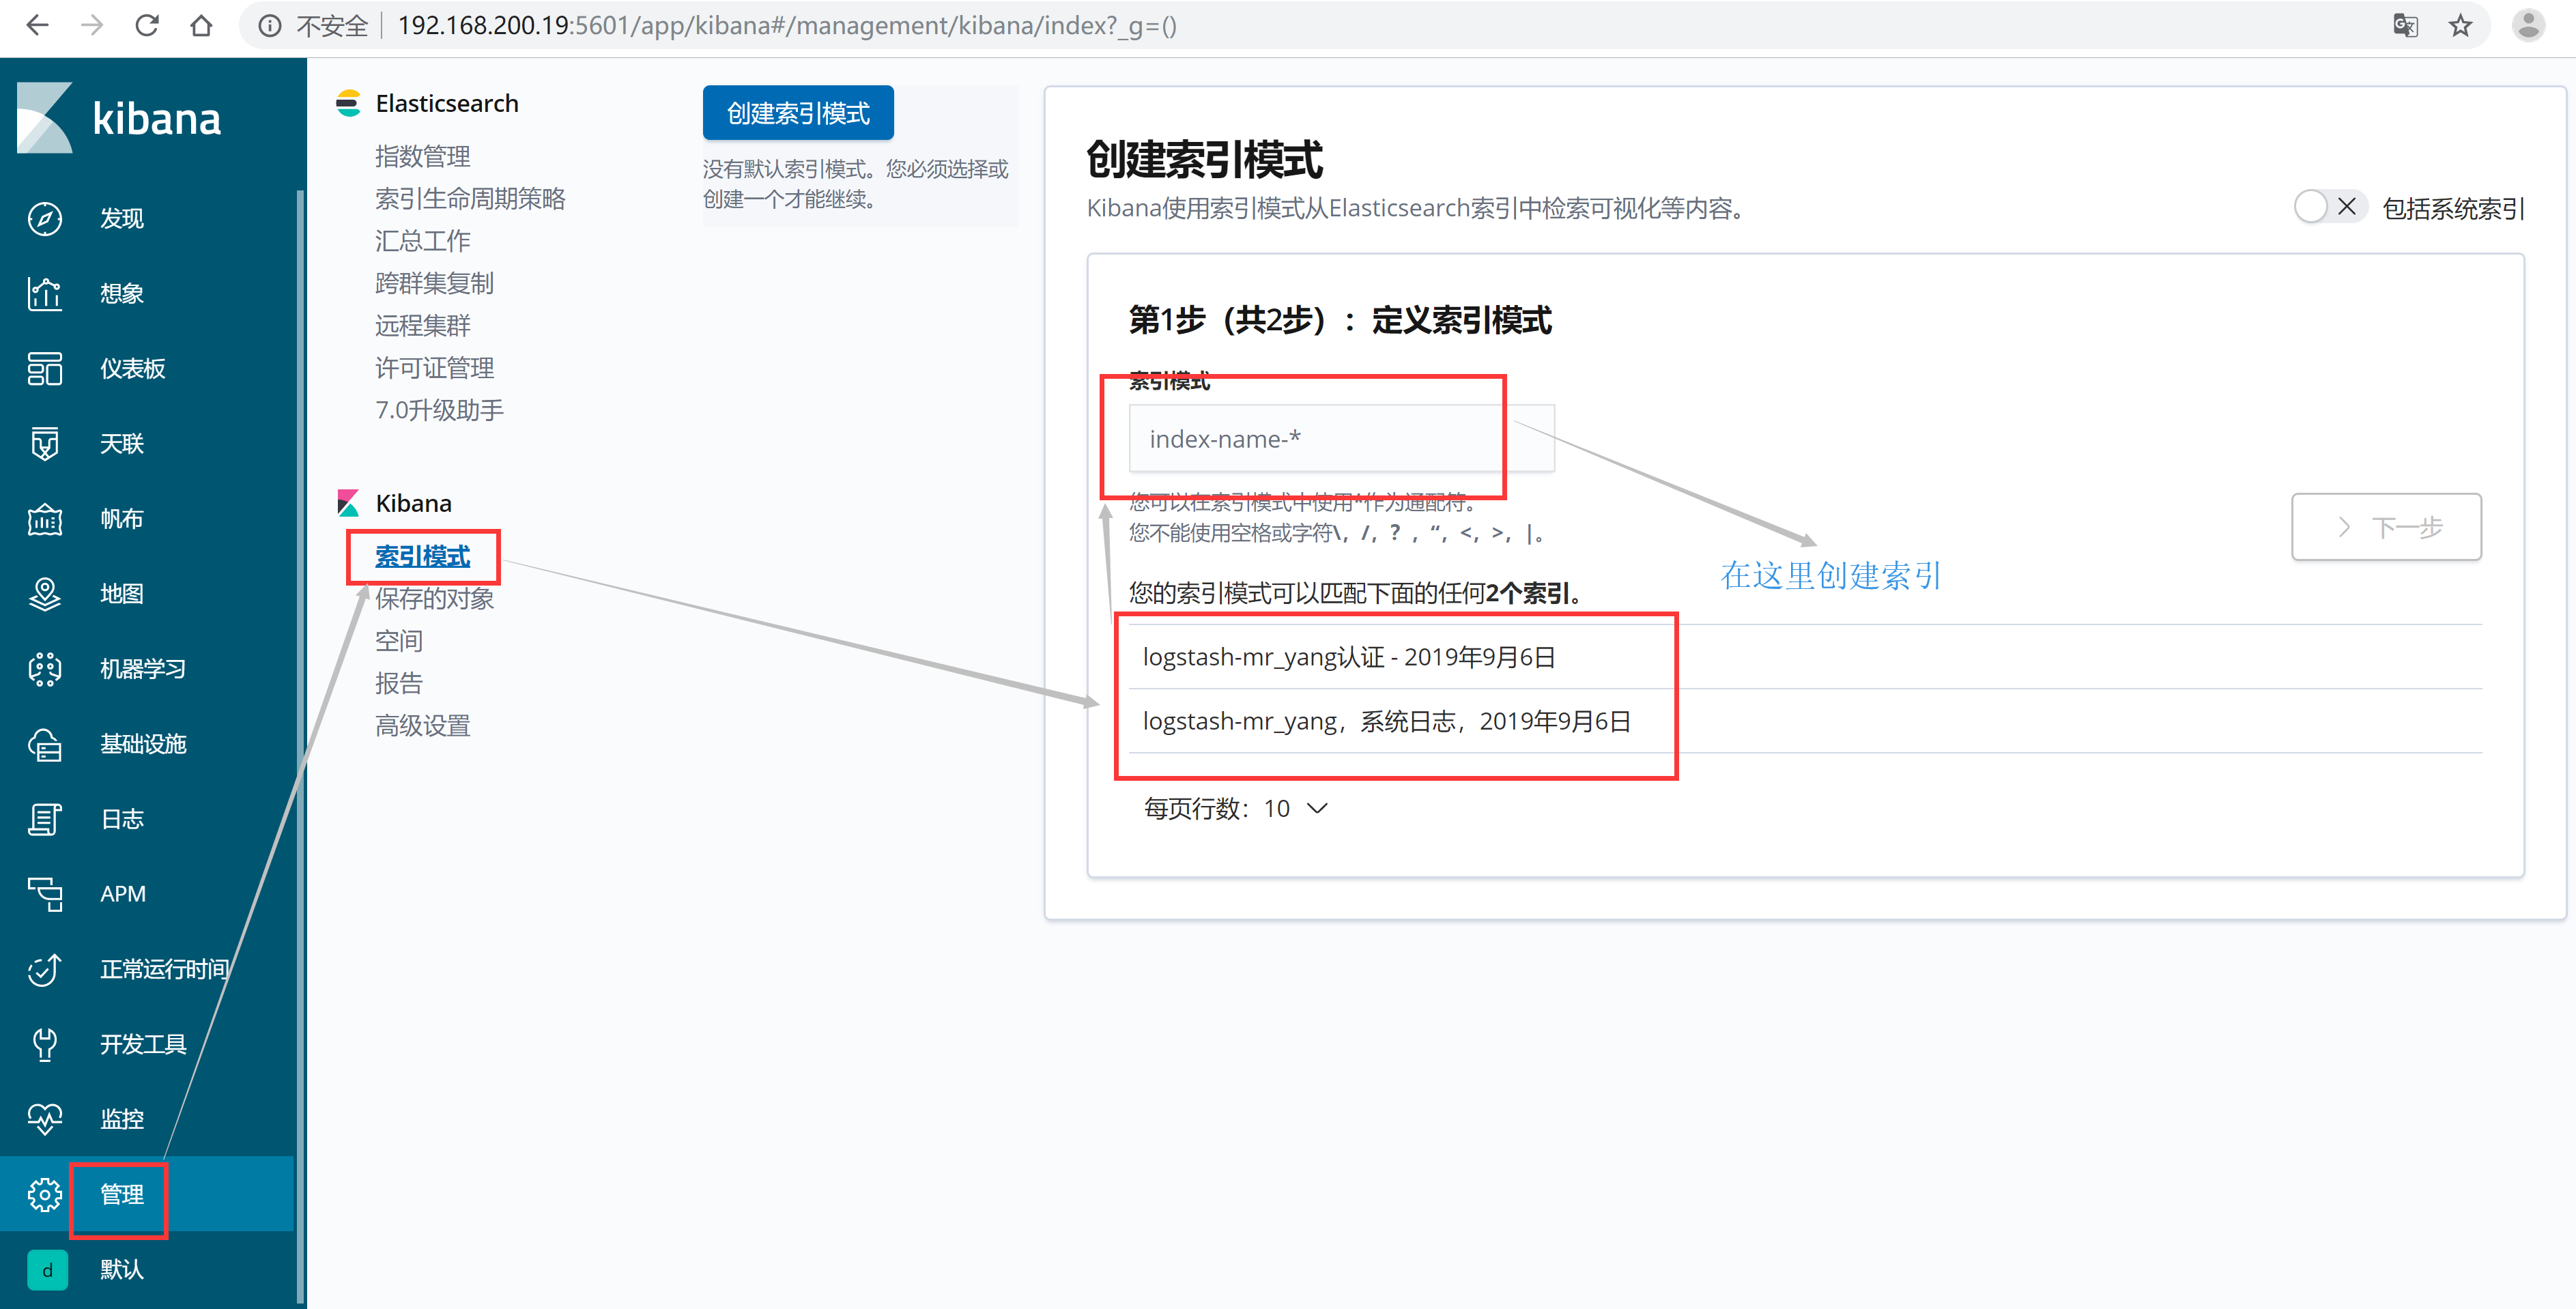
依次创建两个索引
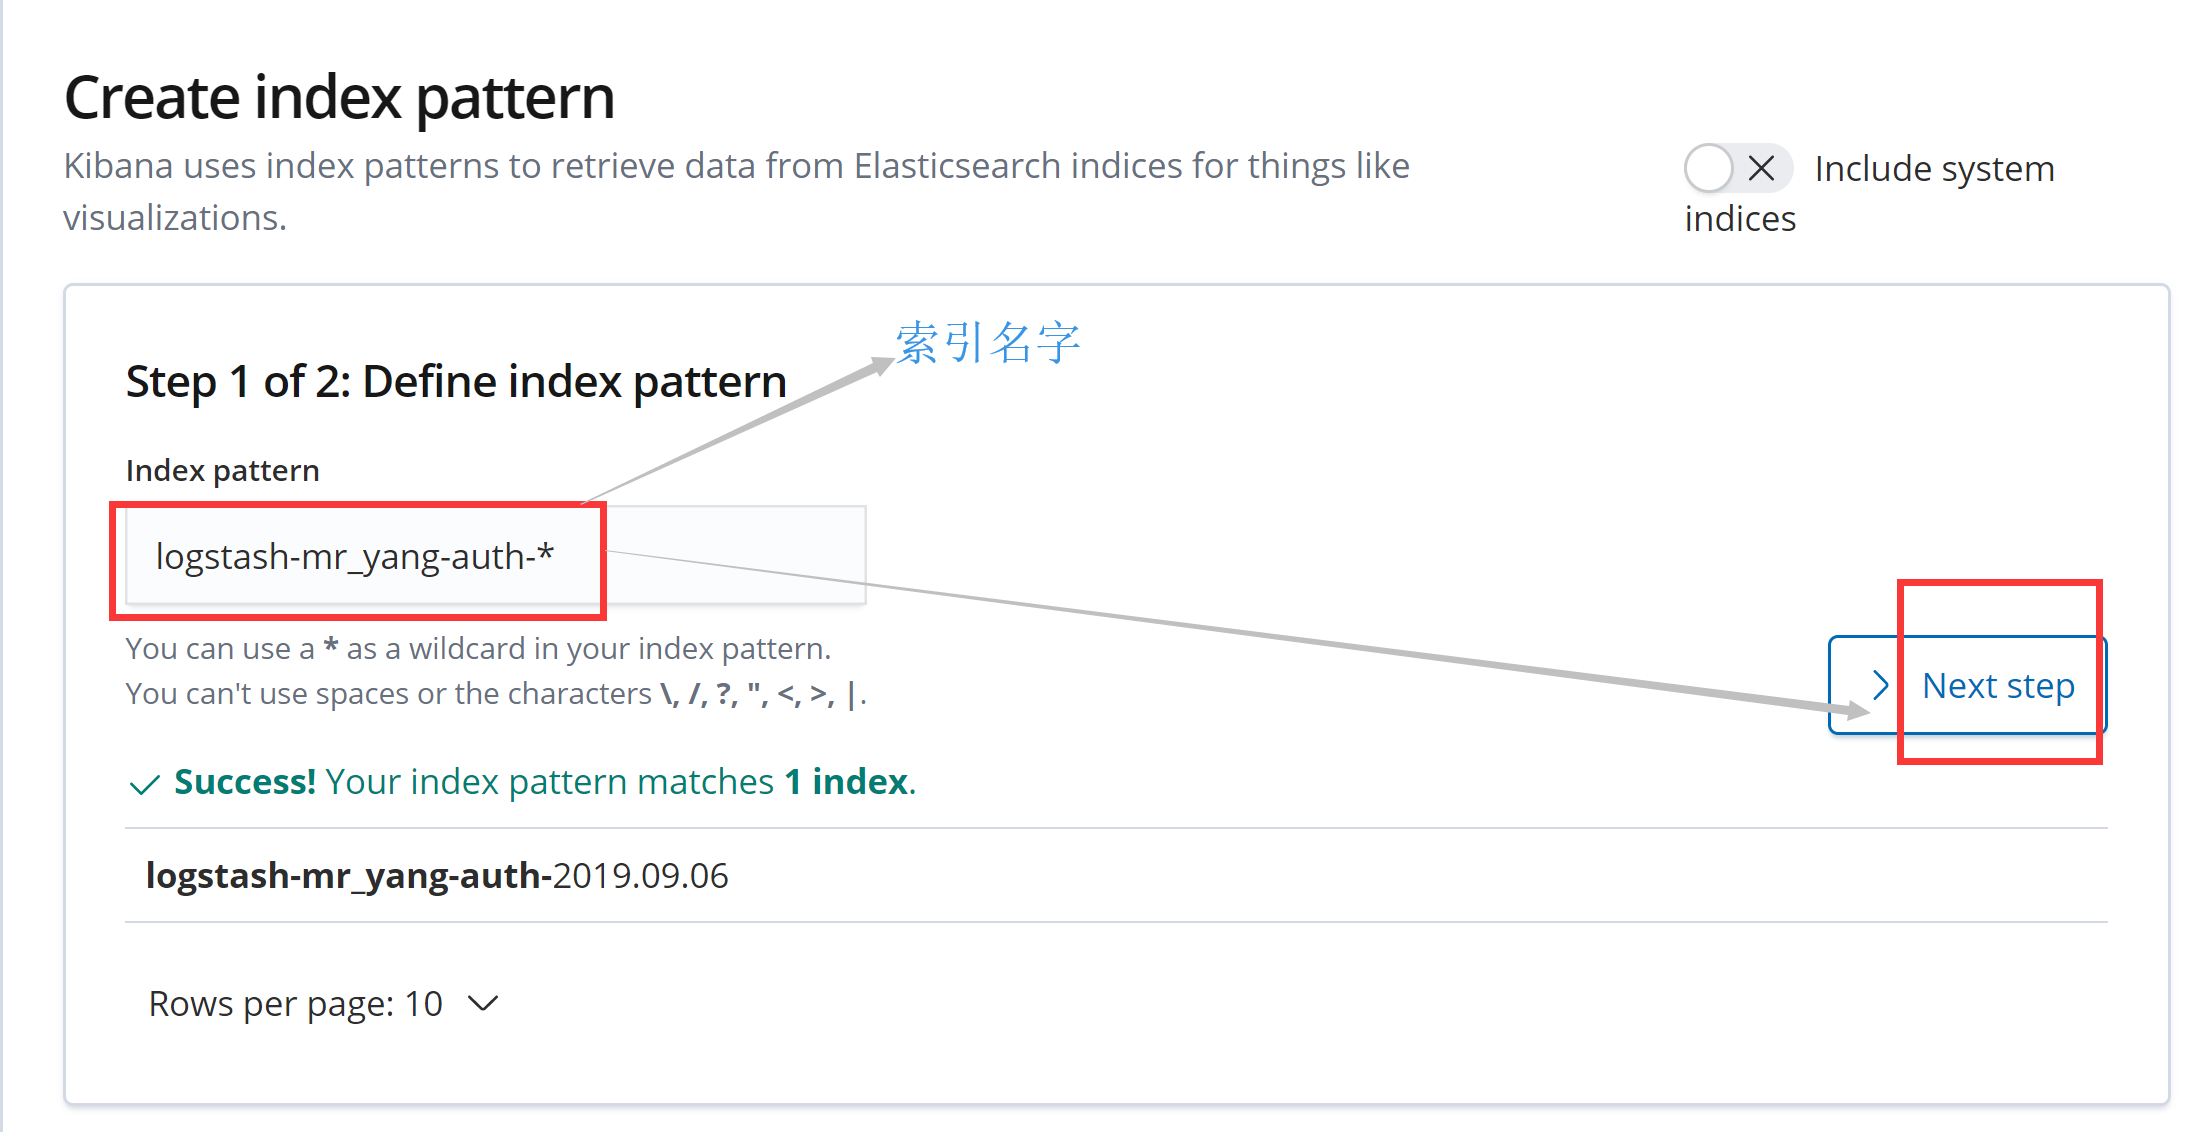
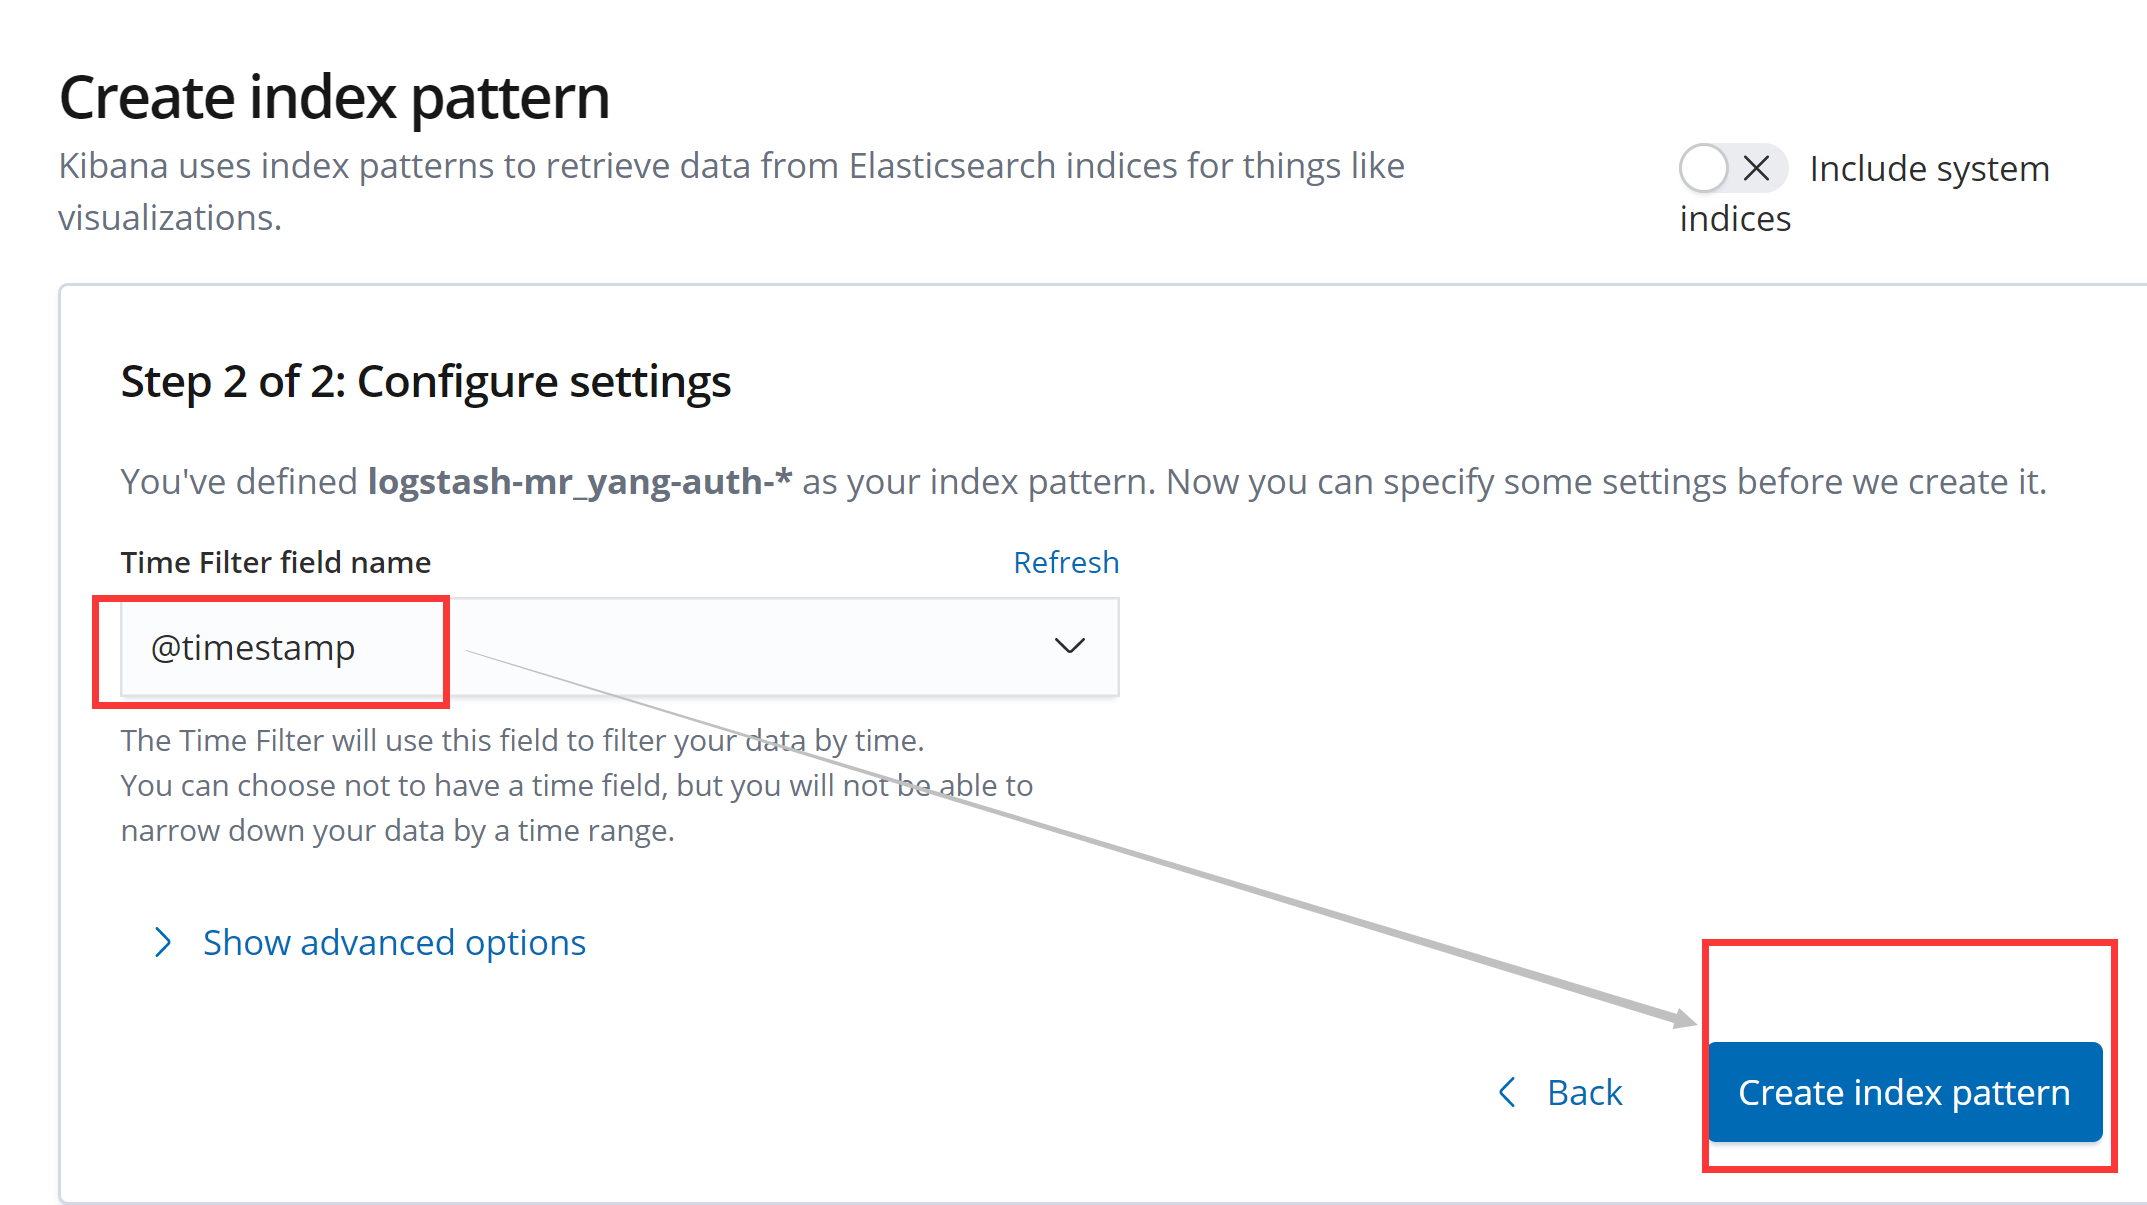
创建两个索引后,如下图所示
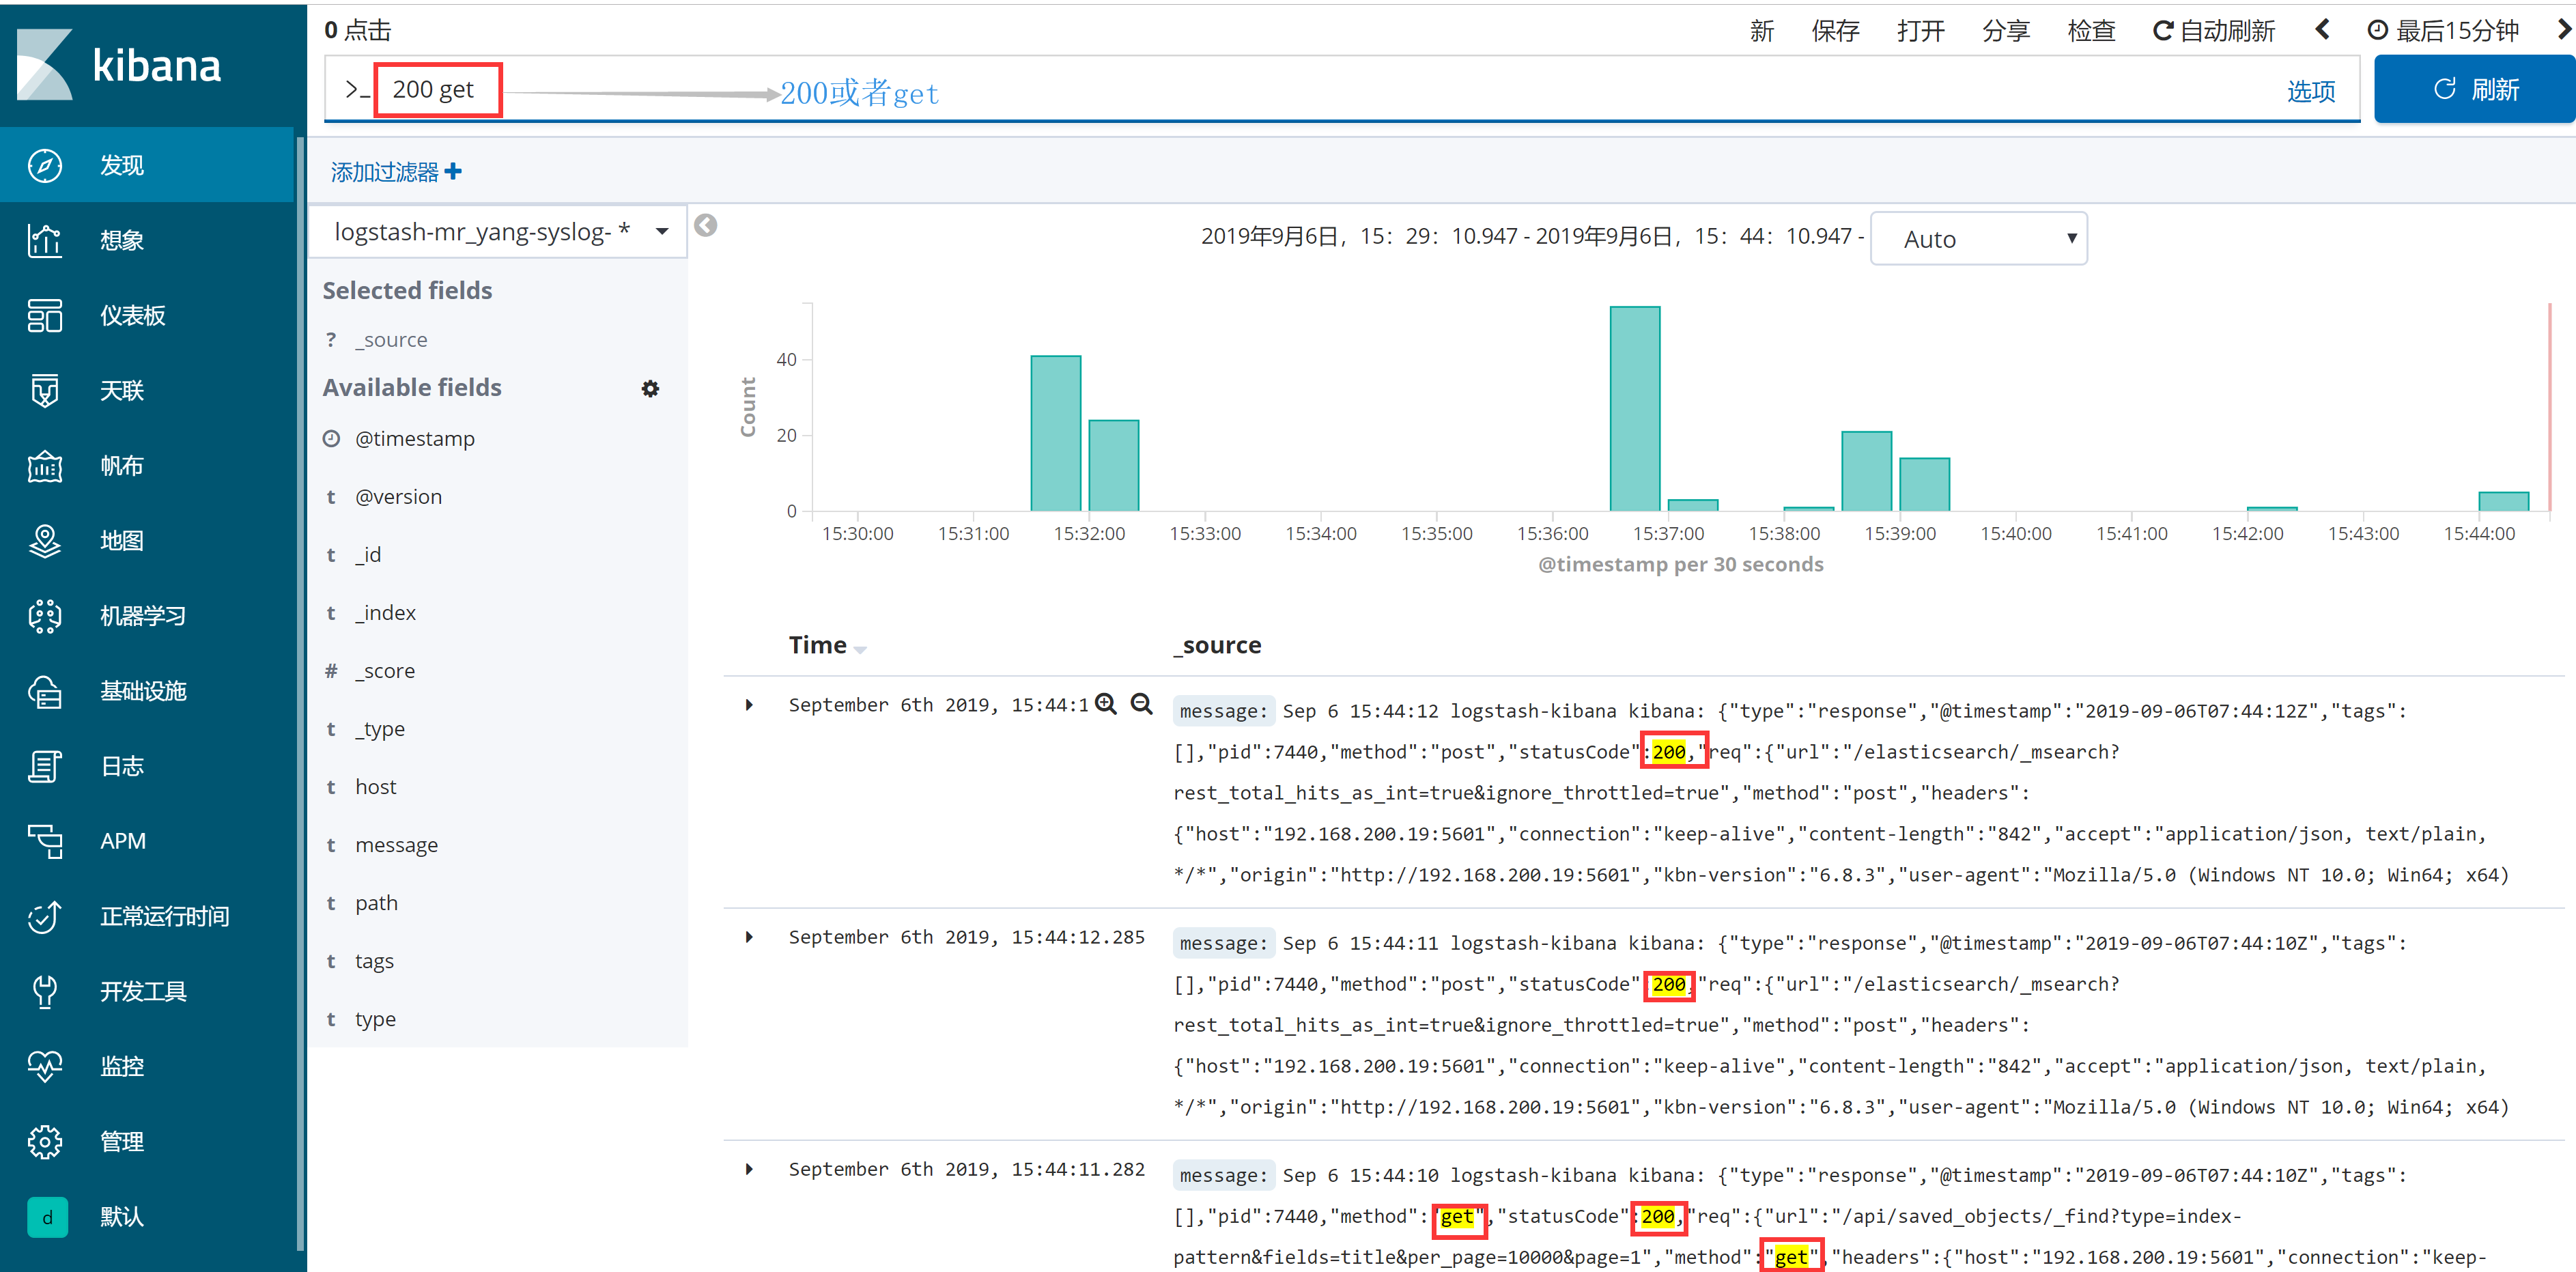
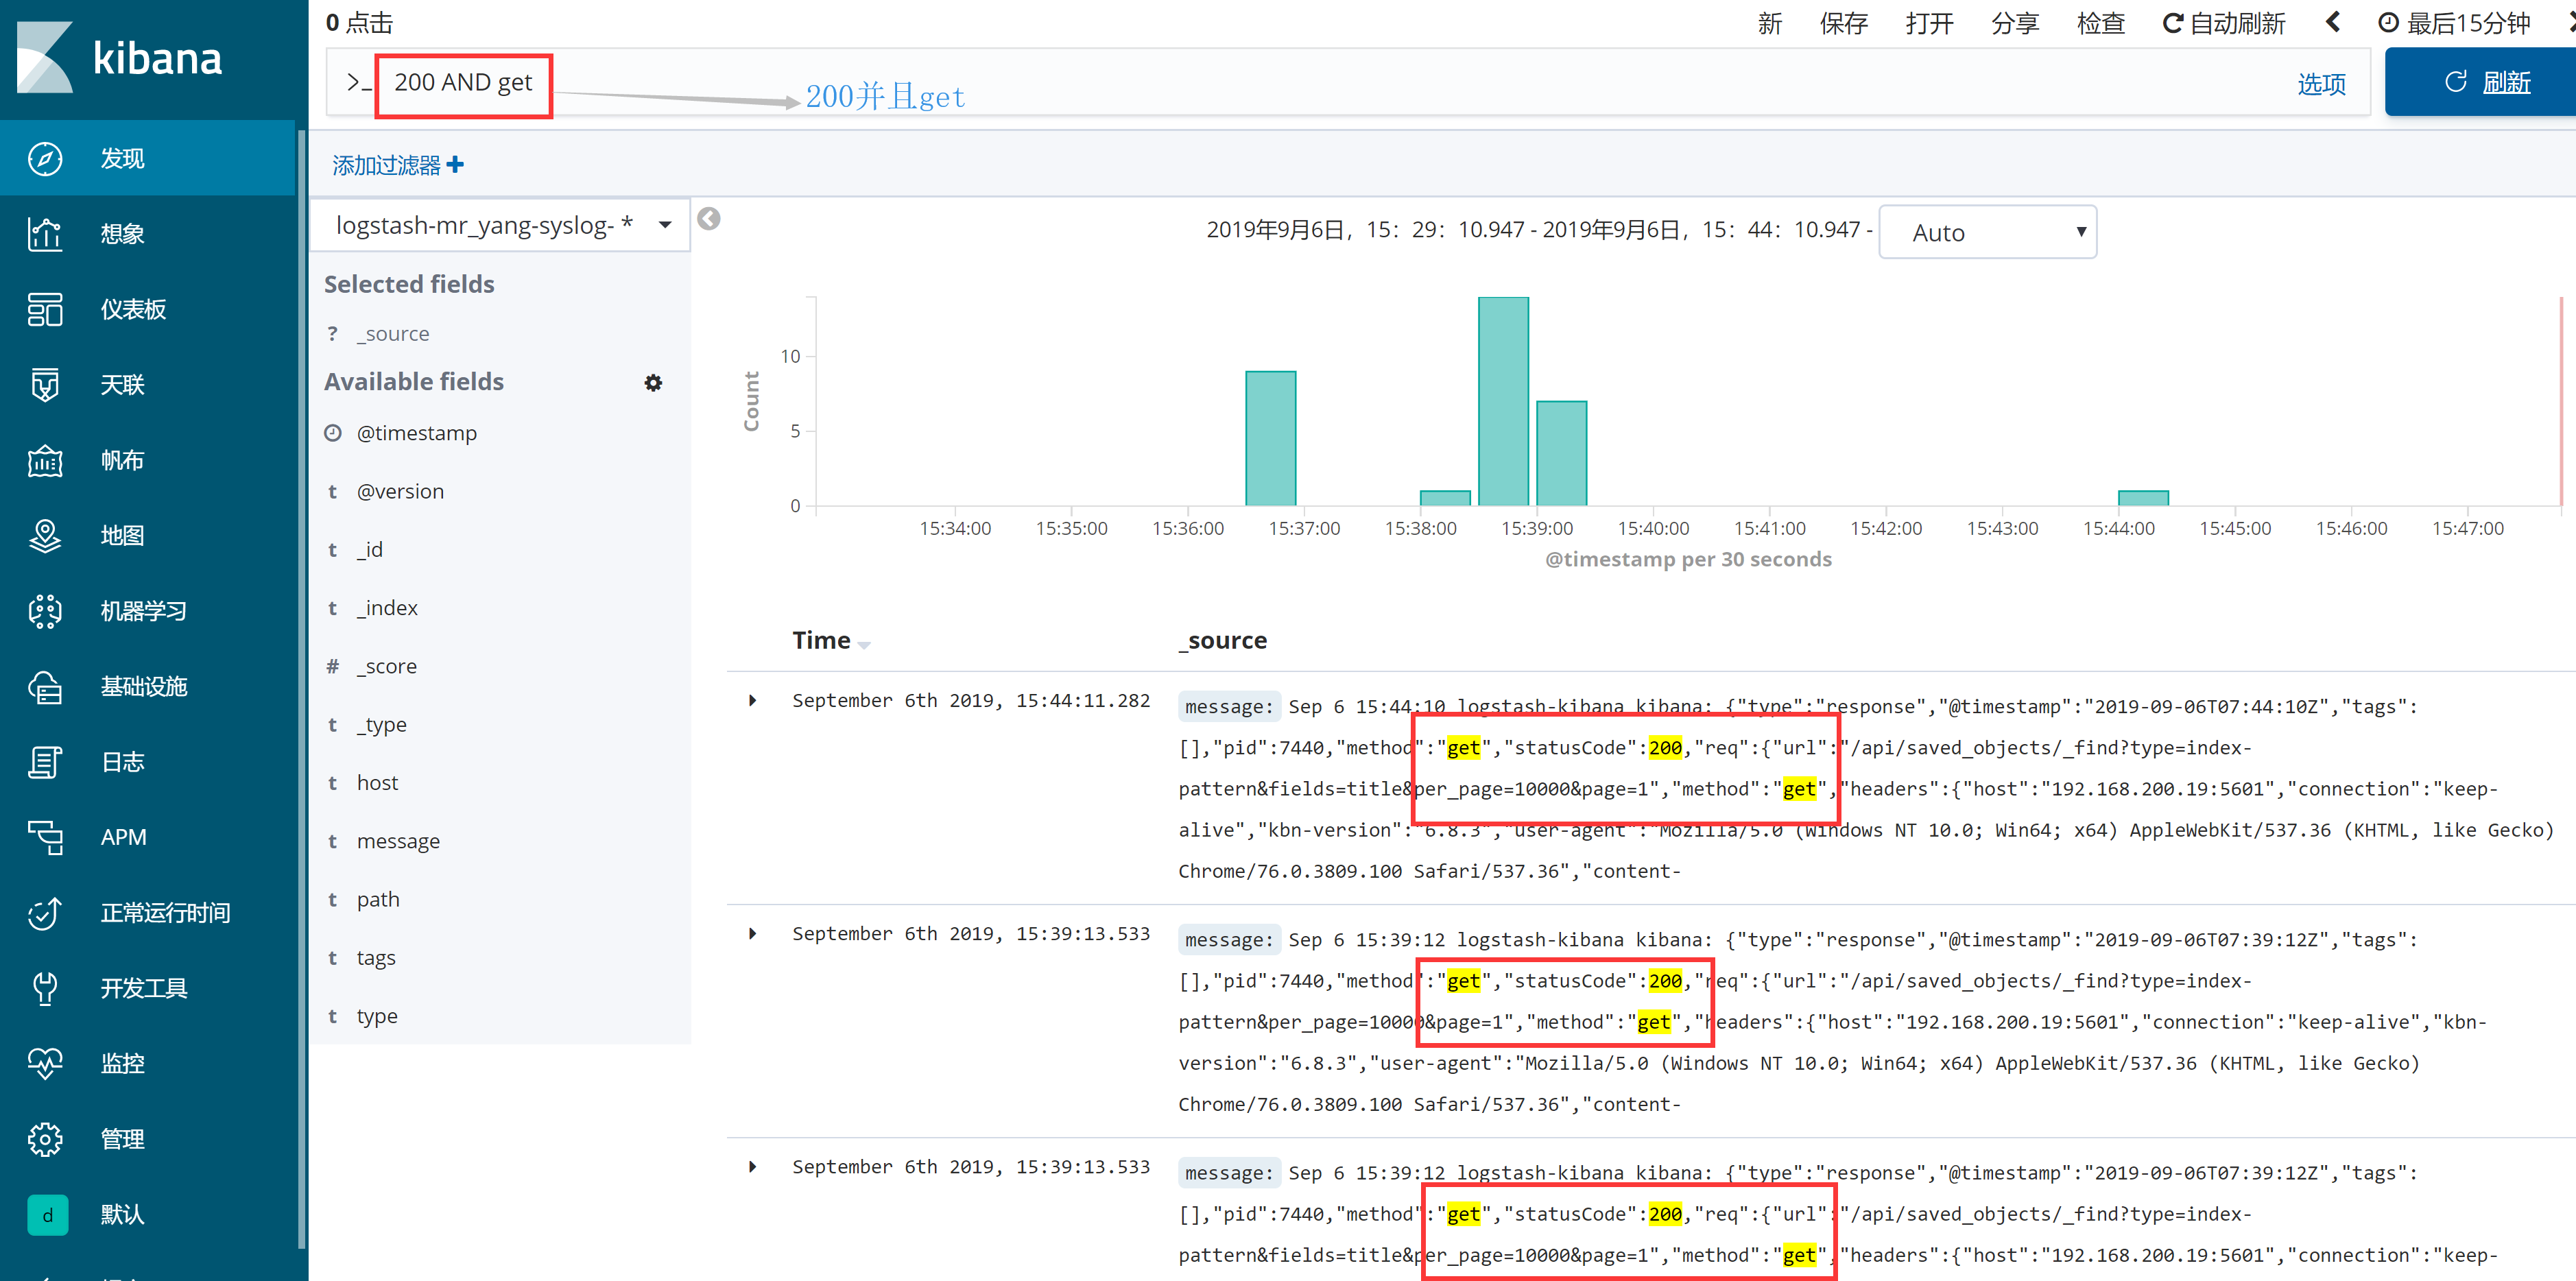
3.2 Kibana常用查询表达式
直接演示简单讲解kibana的数据检索功能