Prometheus架构描述
Prometheus 是一个非常优秀的监控工具。准确的说,应该是监控方案。Prometheus 提供了监控数据搜集、存储、处理、可视化和告警一套完整的解决方案
Prometheus 最大的亮点和先进性是它的多维数据模型
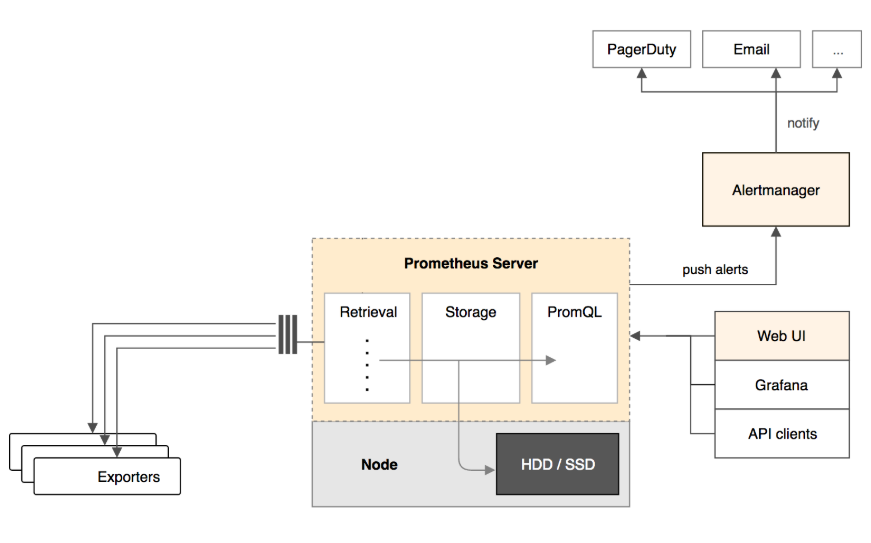
Prometheus Server
Prometheus Server 负责从 Exporter 拉取和存储监控数据,并提供一套灵活的查询语言(PromQL)供用户使用
Exporter
Exporter 负责收集目标对象(host, container…)的性能数据,并通过 HTTP 接口供 Prometheus Server 获取
可视化组件
监控数据的可视化展现对于监控方案至关重要。以前 Prometheus 自己开发了一套工具,不过后来废弃了,因为开源社区出现了更为优秀的产品 Grafana。Grafana 能够与 Prometheus 无缝集成,提供完美的数据展示能力
Alertmanager
用户可以定义基于监控数据的告警规则,规则会触发告警。一旦 Alermanager 收到告警,会通过预定义的方式发出告警通知。支持的方式包括 Email、PagerDuty、Webhook 等.
Prometheus数据存储模型
Prometheus 只需要定义一个全局的指标 container_memory_usage_bytes,然后通过添加不同的维度数据来满足不同的业务需求

1.通过维度对数据进行说明,附加更多的业务信息,进而满足不同业务的需求.同时维度是可以动态添加的,比如再给数据加上一个 user 维度,就可以按用户来统计容器内存使用量了
2.Prometheus 丰富的查询语言能够灵活、充分地挖掘数据的价值.前面示例中的 avg、sum、by 只是查询语言中很小的一部分功能.Prometheus 对多维数据进行分片、聚合的强大能力
Prometheus搭建实例
1. Prometheus Server
Prometheus Server 本身也将以容器的方式运行在 host 192.168.11.133 上
2. Exporter
Prometheus 有很多现成的 Exporter,完整列表请参考 https://prometheus.io/docs/instrumenting/exporters/
使用:
Node Exporter 负责收集 host 硬件和操作系统数据
cAdvisor 负责收集容器数据
3.Grafana
显示多维数据,Grafana 本身也将以容器方式运行在 host 192.168.11.133 上
1.安装node Exporter收集主机数据 需要在每个主机上都安装


docker run -d -p 9100:9100
-v "/proc:/host/proc"
-v "/sys:/host/sys"
-v "/:/rootfs"
--net=host
prom/node-exporter
--path.procfs /host/proc
--path.sysfs /host/sys
--collector.filesystem.ignored-mount-points "^/(sys|proc|dev|host|etc)($|/)"


#Node Exporter 启动后,将通过 9100 提供 host 的监控数据
http://192.168.11.133:9100/metrics
2.安装cAdvisor收集容器数据 每个跑容器的主机上都需要安装
docker run
--volume=/:/rootfs:ro
--volume=/var/run:/var/run:rw
--volume=/sys:/sys:ro
--volume=/var/lib/docker/:/var/lib/docker:ro
--publish=8080:8080
--detach=true
--name=cadvisor
--net=host
google/cadvisor:latest


[root@node3 ~]# mount -o remount,rw '/sys/fs/cgroup'
[root@node3 ~]# ln -s /sys/fs/cgroup/cpu,cpuacct /sys/fs/cgroup/cpuacct,cpu
3.选择一台主机安装Prometheus Server
docker run -d -p 9090:9090
-v /root/prometheus.yml:/etc/prometheus/prometheus.yml
--name prometheus
--net=host
prom/prometheus
global:
  scrape_interval:     15s # By default, scrape targets every 15 seconds.

  # Attach these labels to any time series or alerts when communicating with
  # external systems (federation, remote storage, Alertmanager).
  external_labels:
    monitor: 'codelab-monitor'

# A scrape configuration containing exactly one endpoint to scrape:
# Here it's Prometheus itself.
scrape_configs:
  # The job name is added as a label `job=<job_name>` to any timeseries scraped from this config.
  - job_name: 'prometheus'

    # Override the global default and scrape targets from this job every 5 seconds.
    scrape_interval: 5s

    static_configs:
      - targets: ['localhost:9090','localhost:8080','localhost:9100','192.168.11.134:8080','192.168.11.134:9100']
static_configs: 指定从哪些 exporter 抓取数据.这里指定了两台 host 上的 Node Exporter 和 cAdvisor
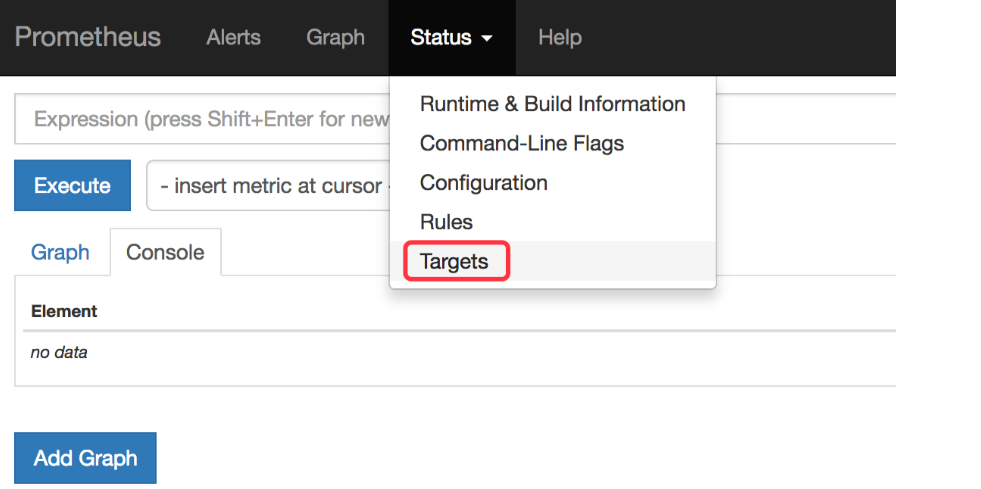
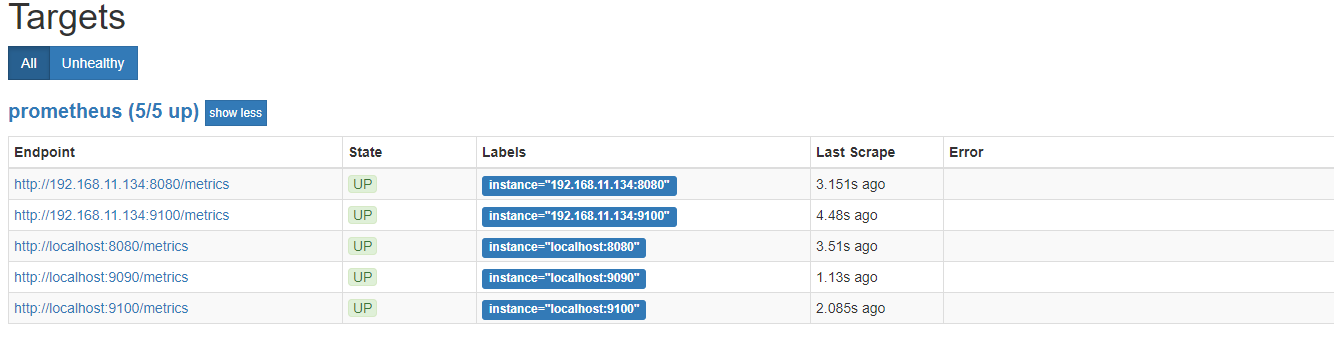
所有 Target 的 State 都是 UP,说明 Prometheus Server 能够正常获取监控数据
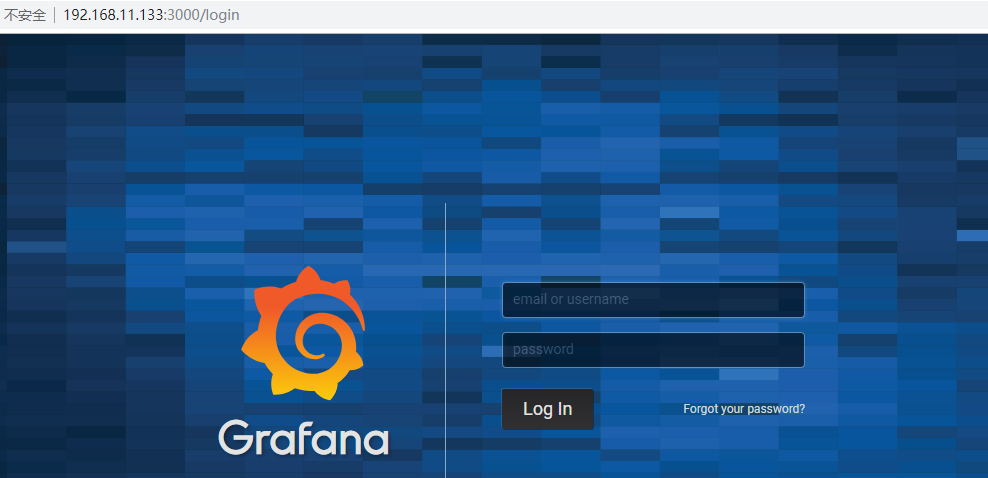
4.安装Grafana 选择和Prometheus Server同一台主机
docker run -d -i -p 3000:3000
-e "GF_SERVER_ROOT_URL=http://grafana.server.name"
-e "GF_SECURITY_ADMIN_PASSWORD=secret"
--net=host
grafana/grafana

-e "GF_SECURITY_ADMIN_PASSWORD=secret 指定了 Grafana admin用户密码 secret
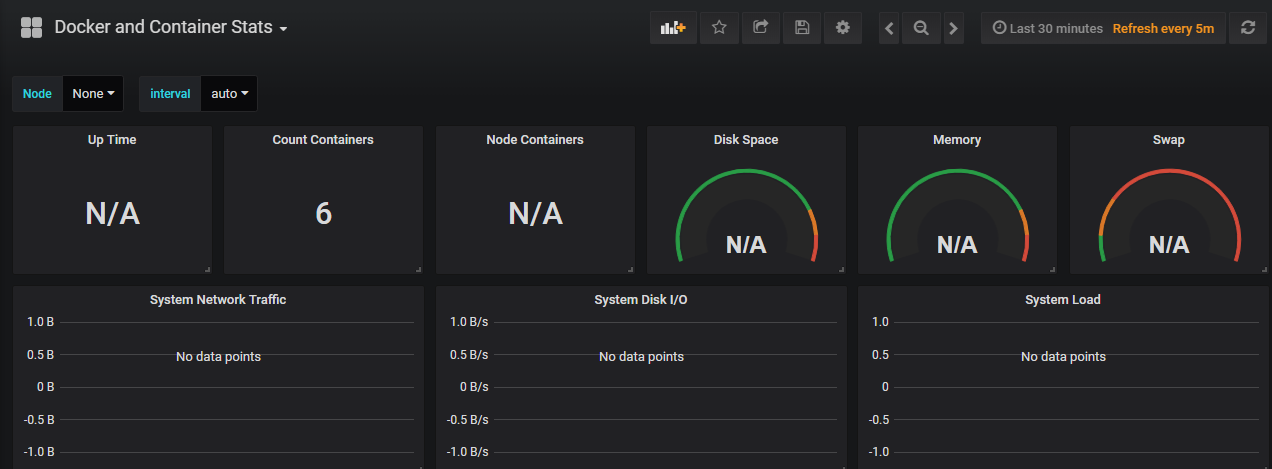
5.使用Grafana展示Prometheus Server的数据
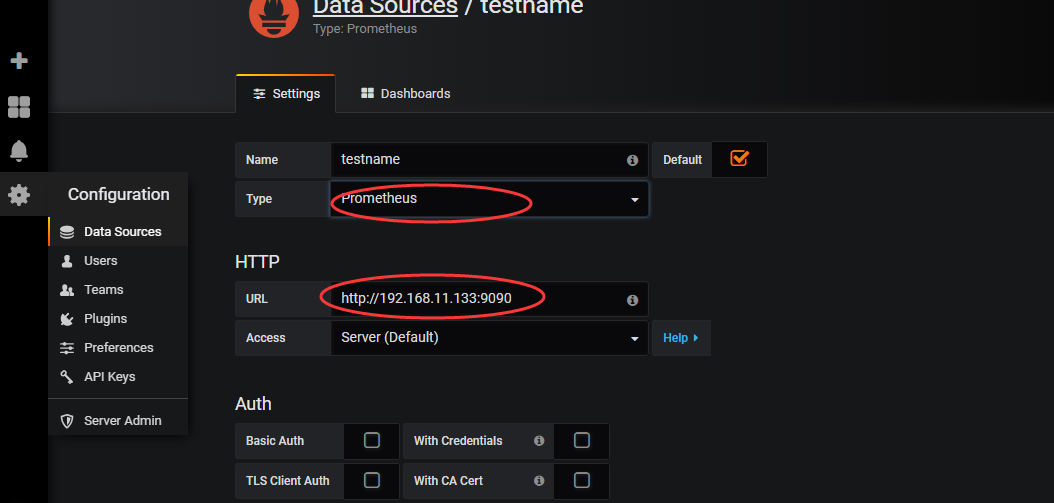
1.添加data source
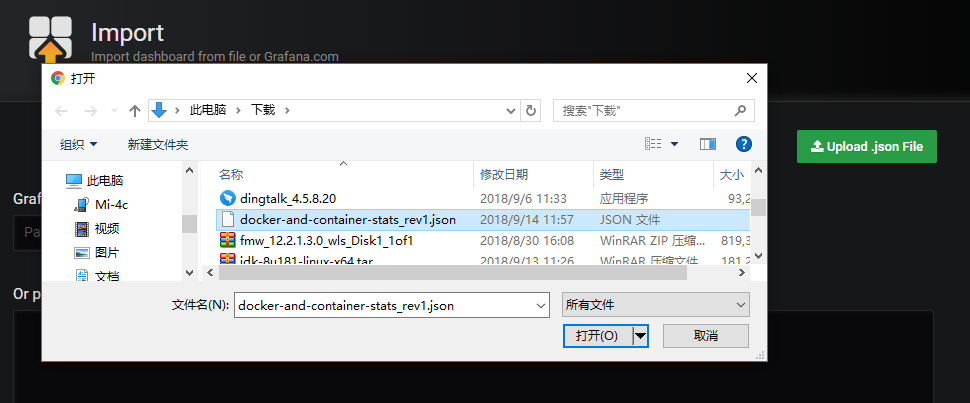
2.下载dashboard
访问 https://grafana.com/dashboards?dataSource=prometheus&search=docker 下载这些现成的 Dashboard 每个Dashboard就是一个json文件
3.添加dashboard