一、加箭头
 axisLine: {
            symbol: ['none', 'arrow'],
            symbolOffset: [0, 4],
            lineStyle: { color: '#707070' }
            },
//以X轴为例
xAxis: [
{
type: 'category',
axisTick: {
//y轴刻度线
show: false
},
//此处加入箭头
axisLine: {
symbol: ['none', 'arrow'],
symbolOffset: [0, 4],
lineStyle: { color: '#707070' }
},
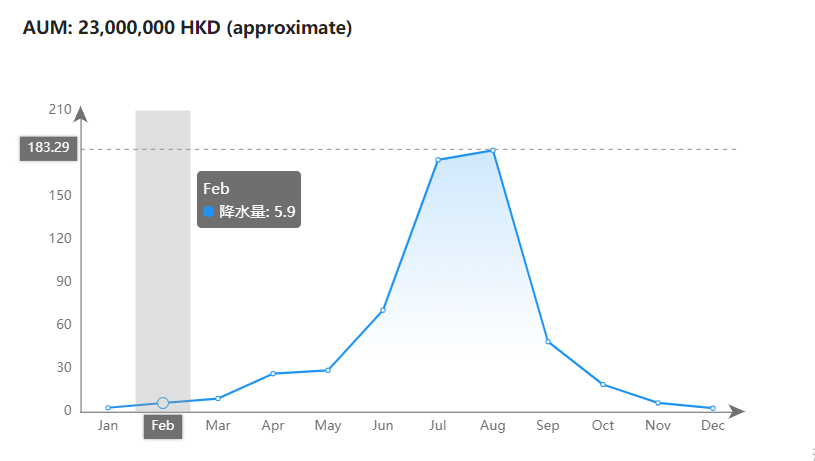
data: [
'Jan',
'Feb',
'Mar',
'Apr',
'May',
'Jun',
'Jul',
'Aug',
'Sep',
'Oct',
'Nov',
'Dec'
],
axisPointer: {
type: 'shadow'
}
}
],
二、加渐变
在 series 中设置渐变色
series: [
                    {
                        name: '降水量',
                        type: 'line',
                        lineStyle: {
                            //线条的相关设置
                            normal: {
                                color: '#1E93F3' // 线条颜色
                            }
                        },
                        //渐变色设置
                        areaStyle: {
                            color: new this.$echarts.graphic.LinearGradient(
                                0,
                                0,
                                0,
                                1,
                                [
                                    {
                                        offset: 0,
                                        color: 'rgba(30,147,243,0.3)'
                                    },
                                    { offset: 0.8, color: 'rgba(30,147,243,0)' }
                                ]
                            )
                        },
                        data: [
                            2.6,
                            5.9,
                            9.0,
                            26.4,
                            28.7,
                            70.7,
                            175.6,
                            182.2,
                            48.7,
                            18.8,
                            6.0,
                            2.3
                        ]
                    }
                ]
最终效果: