zoukankan      html  css  js  c++  java
  • echarts柱状图接口提供的数据是数值,要在顶部展示百分比

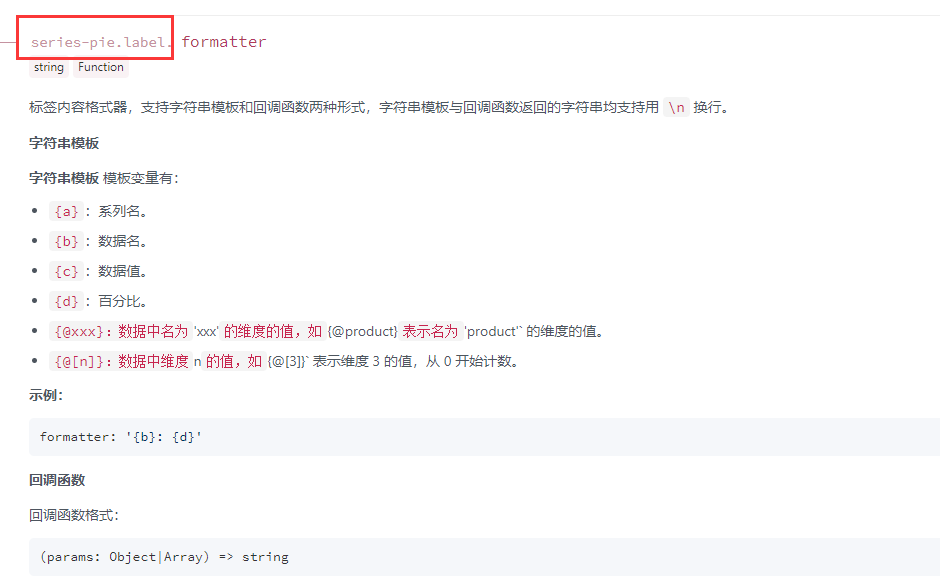
    查阅echarts配置文档,柱状图并没有类似于饼图的直接展示百分比的参数,所以需要自己配置。

    window.onload = function () {
        var list1=[25.02,19.76, 14.71, 14.11, 14.65];
        var list2= [69.04,71.66,76.76,75.78,73.51];
        var option = {
            color:['#4e8df6','#d3e8f9','#feb870','#E87C25','#27727B', '#FE8463','#9BCA63','#FAD860','#F3A43B','#60C0DD','#D7504B','#C6E579','#F4E001'],
            legend: {
                left: 'center',
                top: 'bottom',
            },
            tooltip: {
                formatter: '{a}:{c}%',
            },
            xAxis:[       {
                type: 'category',
                splitLine: {
                    show: true
                },
                data: ['2000年', '2005年', '2010年', '2015年', '2020年']
            }],
         
            yAxis: {
                type: 'value',
                axisLabel: {
                    show: true,
                    interval: 'auto',
                    formatter: '{value}%'
                },
                splitLine: {
                    show: true
                },
                splitArea: {
                    show: true,
                    areaStyle:{
                        color:['#f5f8ff','#fbfbfb']
                    }
                },
                show: true
            },
            series: [
                {
                    name: '甲数据',
                    type: 'bar',
                    label: {
                        show: true,
                        position: 'top',
                        formatter: function(v) {
                            var val = v.data;
                            var total=list1[v.dataIndex]+list2[v.dataIndex]+list3[v.dataIndex];
                            return (val/total*100).toFixed(2) +'%';
        
                        },
                           textStyle : {
                                    fontWeight : 'normal',
                                    fontSize : 12,
                            color:'#205291'
                                  }
                    },
                    data: list1
                },
                {
                    name: '乙数据',
                    type: 'bar',
                    label: {
                                show: true,
                                position: 'top',
                                formatter: function(v) {
                                    var val = v.data;
                                    var total=list1[v.dataIndex]+list2[v.dataIndex]+list3[v.dataIndex];
                                    return (val/total*100).toFixed(2) +'%';
                
                                },
                                 textStyle : {
                                            fontWeight : 'normal',
                                            fontSize : 12,
                                    color:'#205291'
                                          }
                            },
                    data: list2
                }
            ]
        };
        var myChart = echarts.init(document.getElementById('myecharts0'));
        myChart.setOption(option);
    }
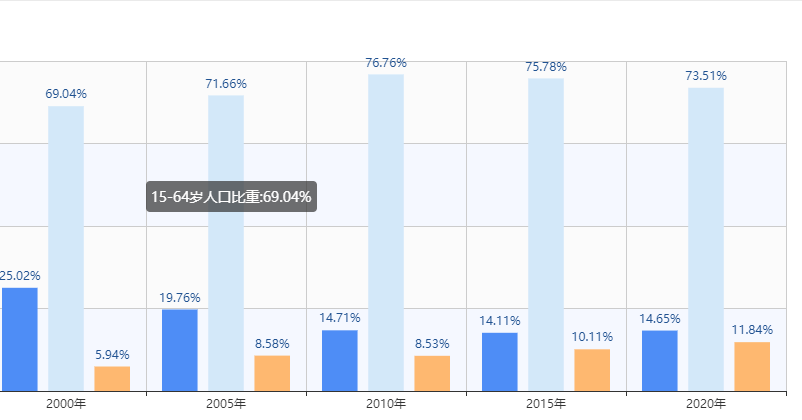
     效果

  • 相关阅读:
    论知识共享平台
    网虫推荐firefox 4.0插件
    solaris下常见文件压缩/解压方式简单小结—待续中
    Nginx的启动,关闭,重启脚本
    怎样将oracle数据库用户锁住和解锁
    【APACHE】如何重启Apache?
    【MYSQL】解决Mysql直接登录问题(删除匿名用户)
    【PHP】关于set和get函数
    【JMAIL】jmail无法收邮件问题
    【PHP】Class ‘mysqli’ not found 问题
  • 原文地址:https://www.cnblogs.com/zaco/p/14048405.html
Copyright © 2011-2022 走看看