https://www.sqlskills.com/blogs/paul/wait-statistics-or-please-tell-me-where-it-hurts/
(Check out my Pluralsight online training course: SQL Server: Performance Troubleshooting Using Wait Statistics and my comprehensive library of all wait types and latch classes.)
How many times have you walked up to a SQL Server that has a performance problem and wondered where to start looking?
One of the most under-utilized performance troubleshooting methodologies in the SQL Server world is one called “waits and queues” (also known simply as “wait stats”). The basic premise is that SQL Server is permanently tracking why execution threads have to wait. You can ask SQL Server for this information and then use the results to narrow down where to start digging to unearth the cause of performance issues. The “waits” are what SQL Server tracks. The “queues” are the resources that the threads are waiting for. There are a myriad of waits in the system and they all indicate different resources being waited for. For example, a PAGEIOLATCH_EX wait means a thread is waiting for a data page to be read into the buffer pool from disk. An LCK_M_X wait means a thread is waiting to be granted an exclusive lock on something.
The great thing about all of this is the SQL Server *knows* where the performance issues are, and you just need to ask it…. and then interpret what it tells you, which can be a little tricky.
Now – where people sometimes get hung up is trying to track down every last wait and figure out what’s causing it. Waits *always* occur. It’s the way SQL Server’s scheduling system works.
A thread is using the CPU (called RUNNING) until it needs to wait for a resource. It then moves to an unordered list of threads that are SUSPENDED. In the meantime, the next thread on the FIFO (first-in-first-out) queue of threads waiting for the CPU (called being RUNNABLE) is given the CPU and becomes RUNNING. If a thread on the SUSPENDED list is notified that it’s resource is available, it becomes RUNNABLE and is put on the bottom of the RUNNABLE queue. Threads continue this clockwise movement from RUNNING to SUSPENDED to RUNNABLE to RUNNING again until the task is completed. You can see processes in these states using the sys.dm_exec_requests DMV.
SQL Server keeps track of the time that elapses between leaving the RUNNING state and becoming RUNNING again (called the “wait time”) and the time spent on the RUNNABLE queue (called the “signal wait time” – i.e. how long does the thread need to wait for the CPU after being signaled that its resource is available). We need to work out the time spent waiting on the SUSPENDED list (called the “resource wait time”) by subtracting the signal wait time from the overall wait time.
A great resource is the new (2014) whitepaper on wait statistics: SQL Server Performance Tuning Using Wait Statistics: A Beginners Guide, which I encourage you to read. There’s also a much older whitepaper (Performance Tuning Using Waits and Queues) which has a lot of useful information, but it’s pretty dated now. The best guide to what the various wait types (and latch classes) mean are my comprehensive waits and latches libraries and the methodology of using and understanding wait statistics is described and demonstrated in my Pluralsight online training course.
You should also check out the following categories on my blog for more along these lines:
- Wait Stats
- Latches (more advanced)
- Spinlocks (very advanced)
You can ask SQL Server for the cumulative wait statistics using the sys.dm_os_wait_stats DMV, and many people prefer to wrap the DMV call in some aggregation code. See below for the most recent version of my script, as of 2016, that works on all versions and includes wait types for SQL Server 2016 (for a script to use on Azure, see here):
|
1
2
3
4
5
6
7
8
9
10
11
12
13
14
15
16
17
18
19
20
21
22
23
24
25
26
27
28
29
30
31
32
33
34
35
36
37
38
39
40
41
42
43
44
45
46
47
48
49
50
51
52
53
54
55
56
57
58
59
60
61
62
63
64
65
66
67
68
69
70
71
72
73
|
WITH [Waits] AS (SELECT [wait_type], [wait_time_ms] / 1000.0 AS [WaitS], ([wait_time_ms] - [signal_wait_time_ms]) / 1000.0 AS [ResourceS], [signal_wait_time_ms] / 1000.0 AS [SignalS], [waiting_tasks_count] AS [WaitCount], 100.0 * [wait_time_ms] / SUM ([wait_time_ms]) OVER() AS [Percentage], ROW_NUMBER() OVER(ORDER BY [wait_time_ms] DESC) AS [RowNum] FROM sys.dm_os_wait_stats WHERE [wait_type] NOT IN ( N'BROKER_EVENTHANDLER', N'BROKER_RECEIVE_WAITFOR', N'BROKER_TASK_STOP', N'BROKER_TO_FLUSH', N'BROKER_TRANSMITTER', N'CHECKPOINT_QUEUE', N'CHKPT', N'CLR_AUTO_EVENT', N'CLR_MANUAL_EVENT', N'CLR_SEMAPHORE', -- Maybe uncomment these four if you have mirroring issues N'DBMIRROR_DBM_EVENT', N'DBMIRROR_EVENTS_QUEUE', N'DBMIRROR_WORKER_QUEUE', N'DBMIRRORING_CMD', N'DIRTY_PAGE_POLL', N'DISPATCHER_QUEUE_SEMAPHORE', N'EXECSYNC', N'FSAGENT', N'FT_IFTS_SCHEDULER_IDLE_WAIT', N'FT_IFTSHC_MUTEX', -- Maybe uncomment these six if you have AG issues N'HADR_CLUSAPI_CALL', N'HADR_FILESTREAM_IOMGR_IOCOMPLETION', N'HADR_LOGCAPTURE_WAIT', N'HADR_NOTIFICATION_DEQUEUE', N'HADR_TIMER_TASK', N'HADR_WORK_QUEUE', N'KSOURCE_WAKEUP', N'LAZYWRITER_SLEEP', N'LOGMGR_QUEUE', N'MEMORY_ALLOCATION_EXT', N'ONDEMAND_TASK_QUEUE', N'PREEMPTIVE_XE_GETTARGETSTATE', N'PWAIT_ALL_COMPONENTS_INITIALIZED', N'PWAIT_DIRECTLOGCONSUMER_GETNEXT', N'QDS_PERSIST_TASK_MAIN_LOOP_SLEEP', N'QDS_ASYNC_QUEUE', N'QDS_CLEANUP_STALE_QUERIES_TASK_MAIN_LOOP_SLEEP', N'QDS_SHUTDOWN_QUEUE', N'REDO_THREAD_PENDING_WORK', N'REQUEST_FOR_DEADLOCK_SEARCH', N'RESOURCE_QUEUE', N'SERVER_IDLE_CHECK', N'SLEEP_BPOOL_FLUSH', N'SLEEP_DBSTARTUP', N'SLEEP_DCOMSTARTUP', N'SLEEP_MASTERDBREADY', N'SLEEP_MASTERMDREADY', N'SLEEP_MASTERUPGRADED', N'SLEEP_MSDBSTARTUP', N'SLEEP_SYSTEMTASK', N'SLEEP_TASK', N'SLEEP_TEMPDBSTARTUP', N'SNI_HTTP_ACCEPT', N'SP_SERVER_DIAGNOSTICS_SLEEP', N'SQLTRACE_BUFFER_FLUSH', N'SQLTRACE_INCREMENTAL_FLUSH_SLEEP', N'SQLTRACE_WAIT_ENTRIES', N'WAIT_FOR_RESULTS', N'WAITFOR', N'WAITFOR_TASKSHUTDOWN', N'WAIT_XTP_RECOVERY', N'WAIT_XTP_HOST_WAIT', N'WAIT_XTP_OFFLINE_CKPT_NEW_LOG', N'WAIT_XTP_CKPT_CLOSE', N'XE_DISPATCHER_JOIN', N'XE_DISPATCHER_WAIT', N'XE_TIMER_EVENT') AND [waiting_tasks_count] > 0 )SELECT MAX ([W1].[wait_type]) AS [WaitType], CAST (MAX ([W1].[WaitS]) AS DECIMAL (16,2)) AS [Wait_S], CAST (MAX ([W1].[ResourceS]) AS DECIMAL (16,2)) AS [Resource_S], CAST (MAX ([W1].[SignalS]) AS DECIMAL (16,2)) AS [Signal_S], MAX ([W1].[WaitCount]) AS [WaitCount], CAST (MAX ([W1].[Percentage]) AS DECIMAL (5,2)) AS [Percentage], CAST ((MAX ([W1].[WaitS]) / MAX ([W1].[WaitCount])) AS DECIMAL (16,4)) AS [AvgWait_S], CAST ((MAX ([W1].[ResourceS]) / MAX ([W1].[WaitCount])) AS DECIMAL (16,4)) AS [AvgRes_S], CAST ((MAX ([W1].[SignalS]) / MAX ([W1].[WaitCount])) AS DECIMAL (16,4)) AS [AvgSig_S],FROM [Waits] AS [W1]INNER JOIN [Waits] AS [W2] ON [W2].[RowNum] <= [W1].[RowNum]GROUP BY [W1].[RowNum]HAVING SUM ([W2].[Percentage]) - MAX( [W1].[Percentage] ) < 95; -- percentage thresholdGO |
This will show the waits grouped together as a percentage of all waits on the system, in decreasing order. The waits to be concerned about (potentially) are those at the top of the list as this represents the majority of where SQL Server is spending it’s time waiting. You can see that a bunch of waits are being filtered out of consideration – as I said above, waits happen all the time and these are the benign ones we can usually ignore.
You can also reset the aggregated statistics using this code:
|
1
2
|
DBCC SQLPERF (N'sys.dm_os_wait_stats', CLEAR);GO |
And of course you can very easily come up with a way to persist the results every few hours or every day and do some time-series analysis to figure out trends or automatically spot problems as they start to happen. On SQL Server 2000 you can use DBCC SQLPERF (N’waitstats’), and most 3rd-party performance monitoring tools show you wait statistics too.
Once you get the results, you then start figuring out how to interpret them and where to go looking. The whitepaper I referenced above has a some good info on many wait types (but is only relevant to 2005 and sometimes tends towards the knee-jerk response). There are various ways you can dig in deeper to this information that I’ll go into in later posts (referenced above).
I’m going to start blogging about wait stats analysis, either as standalone posts or as part of other things – and I’ve already done so in the last post (at time of writing this) in my benchmarking series.
For now, I want to report on the results of the wait stats survey I posted a couple of months back. I asked people to run the original version of the large query above and let me know the results. I received results for a whopping 1823 SQL Servers out there – thank you!
Here’s a graphical view of the results:
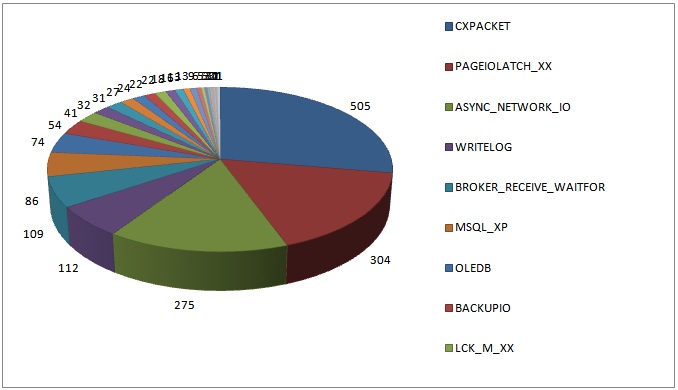
I’m not surprised at all by the top four results as I see these over and over on client systems.
For the remainder of this post, I’m going to list all the top wait types reported by survey respondents, in descending order, and give a few words about what they might mean if they are the most prevalent wait on your system. The list format shows the number of systems with that wait type as the most prevalent, and then the wait type.
Make sure you also check out the more recent post What is the most worrying wait type? for more in-depth and up-to-date information.
For all these wait types, you can click the name of the wait to go to its entry in the new wait stats library I released in May 2016.
- 505: CXPACKET
- This indicates parallelism, not necessarily that there’s a problem. The coordinator thread in a parallel query always accumulates these waits. If the parallel threads are not given equal amounts of work to do, or one thread blocks, the waiting threads will also accumulate CXPACKET waits, which will make them aggregate a lot faster – this is a problem. One thread may have a lot more to do than the others, and so the whole query is blocked while the long-running thread completes. If this is combined with a high number of PAGEIOLATCH_XX waits, it could be large parallel table scans going on because of incorrect non-clustered indexes, or a bad query plan. If neither of these are the issue, you might want to try setting MAXDOP to 4, 2, or 1 for the offending queries (or possibly the whole instance). Make sure that if you have a NUMA system that you try setting MAXDOP to the number of cores in a single NUMA node first to see if that helps the problem. You also need to consider the MAXDOP effect on a mixed-load system. To be honest, I’d play with the cost threshold for parallelism setting (bump it up to, say, 25) before reducing the MAXDOP of the whole instance. And don’t forget Resource Governor in Enterprise Edition of SQL Server 2008 onward that allows DOP governing for a particular group of connections to the server.
- 2015 update: You can read more about CXPACKET waits in my recent blog posts here and here.
- 304: PAGEIOLATCH_XX
- This is where SQL Server is waiting for a data page to be read from disk into memory. It may indicate a bottleneck at the IO subsystem level (which is a common “knee-jerk” response to seeing these), but why is the I/O subsystem having to service so many reads? It could be buffer pool/memory pressure (i.e. not enough memory for the workload), a sudden change in query plans causing a large parallel scan instead of a seek, plan cache bloat, or a number of other things. Don’t assume the root cause is the I/O subsystem.
- 2015 update: You can read more about PAGEIOLATCH_XX waits in my recent blog post here.
- 275: ASYNC_NETWORK_IO
- This is usually where SQL Server is waiting for a client to finish consuming data. It could be that the client has asked for a very large amount of data or just that it’s consuming it reeeeeally slowly because of poor programming – I rarely see this being a network issue. Clients often process one row at a time – called RBAR or Row-By-Agonizing-Row – instead of caching the data on the client and acknowledging to SQL Server immediately.
- 112: WRITELOG
- This is the log management system waiting for a log flush to disk. It commonly indicates that the I/O subsystem can’t keep up with the log flush volume, but on very high-volume systems it could also be caused by internal log flush limits, that may mean you have to split your workload over multiple databases or even make your transactions a little longer to reduce log flushes. To be sure it’s the I/O subsystem, use the DMV sys.dm_io_virtual_file_stats to examine the I/O latency for the log file and see if it correlates to the average WRITELOG time. If WRITELOG is longer, you’ve got internal contention and need to shard. If not, investigate why you’re creating so much transaction log.
- 2015 update: See here and here for some ideas.
- 109: BROKER_RECEIVE_WAITFOR
- This is just Service Broker waiting around for new messages to receive. I would add this to the list of waits to filter out and re-run the wait stats query.
- 086: MSQL_XP
- This is SQL Server waiting for an extended stored-proc to finish. This could indicate a problem in your XP code.
- 074: OLEDB
- As its name suggests, this is a wait for something communicating using OLEDB – e.g. a linked server. However, OLEDB is also used by all DMVs and by DBCC CHECKDB, so don’t assume linked servers are the problem – it could be a third-party monitoring tool making excessive DMV calls. If it *is* a linked server (wait times in the 10s or 100s of milliseconds), go to the linked server and do wait stats analysis there to figure out what the performance issue is there.
- 054: BACKUPIO
- This can show up when you’re backing up to a slow I/O subsystem, like directly to tape, which is slooooow, or over a network.
- 041: LCK_M_XX
- This is simply the thread waiting for a lock to be granted and indicates blocking problems. These could be caused by unwanted lock escalation or bad programming, but could also be from I/Os taking a long time causing locks to be held for longer than usual. Look at the resource associated with the lock using the DMV sys.dm_os_waiting_tasks. Don’t assume that locking is the root cause.
- 032: ONDEMAND_TASK_QUEUE
- This is normal and is part of the background task system (e.g. deferred drop, ghost cleanup). I would add this to the list of waits to filter out and re-run the wait stats query.
- 031: BACKUPBUFFER
- This commonly show up with BACKUPIO and is a backup thread waiting for a buffer to write backup data into.
- 027: IO_COMPLETION
- This is SQL Server waiting for non-data page I/Os to complete and could be an indication that the I/O subsystem is overloaded if the latencies look high (see Are I/O latencies killing your performance?)
- 024: SOS_SCHEDULER_YIELD
- This is code running that doesn’t hit any resource waits. See here for more details.
- 022: DBMIRROR_EVENTS_QUEUE
- 022: DBMIRRORING_CMD
- These two are database mirroring just sitting around waiting for something to do. I would add these to the list of waits to filter out and re-run the wait stats query.
- 018: PAGELATCH_XX
- This is contention for access to in-memory copies of pages. The most well-known cases of these are the PFS and SGAM contention that can occur in tempdb under certain workloads. To find out what page the contention is on, you’ll need to use the DMV sys.dm_os_waiting_tasksto figure out what page the latch is for. For tempdb issues, Robert Davis (blog|twitter) has a good post showing how to do this. Another common cause I’ve seen is an index hot-spot with concurrent inserts into an index with an identity value key.
- 016: LATCH_XX
- This is contention for some non-page structure inside SQL Server – so not related to I/O or data at all. These can be hard to figure out and you’re going to be using the DMV sys.dm_os_latch_stats. More on this in my Latches category.
- 013: PREEMPTIVE_OS_PIPEOPS
- This is SQL Server switching to preemptive scheduling mode to call out to Windows for something, and this particular wait is usually from using xp_cmdshell. These were added for 2008 and aren’t documented anywhere except through the links to my waits library.
- 013: THREADPOOL
- This says that there aren’t enough worker threads on the system to satisfy demand. Commonly this is large numbers of high-DOP queries trying to execute and taking all the threads from the thread pool.
- 009: BROKER_TRANSMITTER
- This is just Service Broker waiting around for new messages to send. I would add this to the list of waits to filter out and re-run the wait stats query.
- 006: SQLTRACE_WAIT_ENTRIES
- Part of SQL Trace. I would add this to the list of waits to filter out and re-run the wait stats query./li>
- 005: DBMIRROR_DBM_MUTEX
- This one is undocumented and is contention for the send buffer that database mirroring shares between all the mirroring sessions on a server. It could indicate that you’ve got too many mirroring sessions.
- 005: RESOURCE_SEMAPHORE
- This is queries waiting for execution memory (the memory used to process the query operators – like a sort). This could be memory pressure or a very high concurrent workload.
- 003: PREEMPTIVE_OS_AUTHENTICATIONOPS
- 003: PREEMPTIVE_OS_GENERICOPS
- These are SQL Server switching to preemptive scheduling mode to call out to Windows for something. These were added for 2008 and aren’t documented anywhere except through the links to my waits library.
- 003: SLEEP_BPOOL_FLUSH
- This is normal to see and indicates that checkpoint is throttling itself to avoid overloading the IO subsystem. I would add this to the list of waits to filter out and re-run the wait stats query.
- 002: MSQL_DQ
- This is SQL Server waiting for a distributed query to finish. This could indicate a problem with the distributed query, or it could just be normal.
- 002: RESOURCE_SEMAPHORE_QUERY_COMPILE
- When there are too many concurrent query compilations going on, SQL Server will throttle them. I don’t remember the threshold, but this can indicate excessive recompilation, or maybe single-use plans.
- 001: DAC_INIT
- This is the Dedicated Admin Connection initializing. I can’t see how this is the most common wait on someone’s system…
- 001: MSSEARCH
- This is normal to see for full-text operations. If this is the highest wait, it could mean your system is spending most of its time doing full-text queries. You might want to consider adding this to the filter list.
- 001: PREEMPTIVE_OS_FILEOPS
- 001: PREEMPTIVE_OS_LIBRARYOPS
- 001: PREEMPTIVE_OS_LOOKUPACCOUNTSID
- 001: PREEMPTIVE_OS_QUERYREGISTRY
- These are SQL Server switching to preemptive scheduling mode to call out to Windows for something. These were added for 2008 and aren’t documented anywhere except through the links to my waits library.
- 001: SQLTRACE_LOCK
- Part of SQL Trace. I would add this to the list of waits to filter out and re-run the wait stats query.
I hope you found this interesting! Let me know if there’s anything in particular you’re interested in seeing or just that you’re following along and enjoying the ride!