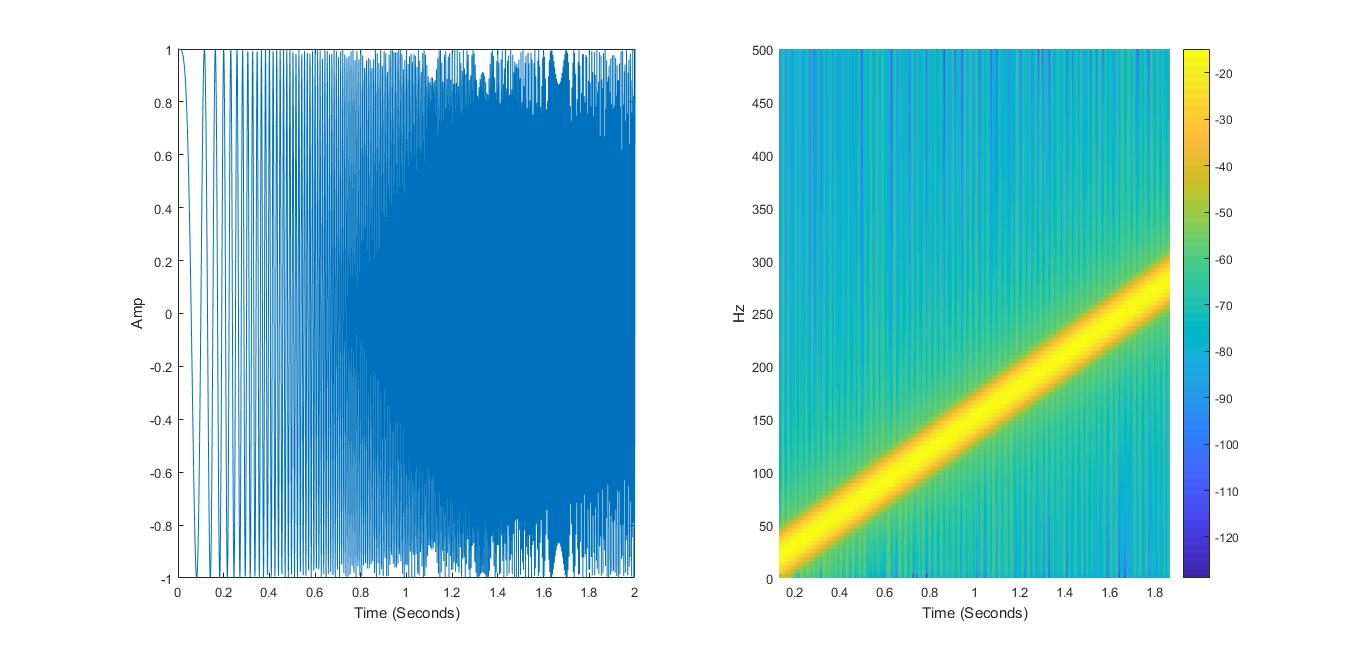
《MATLAB R2016a完全自学一本通》第461页,例14-27。
使用短时傅里叶变换对线性扫描频率信号进行谱估计的命令如下:
MATLAB代码如下:
clear all;clc;close all;  %clear all清空工作区,clc清空命令(可能是clear command缩写),close all关闭所有窗口
T=0:0.001:2;
X=chirp(T,0,1,150);
subplot(121);plot(T,X);
xlabel('Time (Seconds)');ylabel('Amp');
subplot(122);[S,F,T,P]=spectrogram(X,256,250,256,1E3);
surf(T,F,10*log10(P),'edgecolor','none');axis tight;
xlabel('Time (Seconds)');ylabel('Hz');
view(0,90);
colorbar;
图片结果为:

其中,chirp函数用法,参看Swept-frequency cosine - MATLAB chirp - MathWorks 中国,部分翻译如下:
chirp:
扫频余弦(Swept-frequency cosine)
语法(Syntax):
y=chirp(t,f0,t1,f1)
y=chirp(t,f0,t1,f1,'method')
y=chirp(t,f0,t1,f1,'method',phi)
y=chirp(t,f0,t1,f1,'quadratic',phi,shape)
说明(Description):
y = chirp(t,f0,t1,f1) generates samples of a linear swept-frequency cosine signal at the time instances defined in array t, where f0 is the instantaneous frequency at time 0, and f1 is the instantaneous frequency at time t1. f0 and f1 are both in hertz. If unspecified, f0 is e-6 for logarithmic chirp and 0 for all other methods, t1 is 1, and f1 is 100.
y = chirp(t,f0,t1,f1)在数组 t 中定义的时间实例中生成线性扫描余弦信号的样本,其中 f0 是时刻 0 的瞬时频率,f1 是时刻t1的瞬时频率。f0 和 f1 的单位都是赫兹(Hertz)。如果没有明确的数值,对于对数的扫频余弦,f0 取e^-6,其他情况下,f0 取0。t1默认取1,f1默认取100。
后面用法有用到再补充。
view函数用法参看:视点的指定 - MATLAB view - MathWorks 中国