转自: http://petermodzelewski.blogspot.com/2013/06/short-jhat-tutorial-diagnosing.html
jhat这个工具经过使用, 发现非常不好用, 分析稍微比较大一点的dumo文件就会非常慢, 而且占用内存太大, 所以建议用mat.这个教材写的还是不错的, 所以先转载一下
Last time we've learned what can be the reason of OutOfMemoryErrors and what tool-chain can we use to diagnose it. Today we will learn by example how to use the most important one: jhat.
I've prepared a sample project for this exercise, which can be cloned from github. The code is really simple and its problem is obvious, but this simplicity will make it easy to get to know jhat.
First, we need to run our program. We will use small heap size, for two reasons:
- Program will throw the exception faster
- jhat will start more quickly, as the heap dump will be smaller
|
1
2
3
4
5
6
7
|
$ git clone https://github.com/petermodzelewski/snippets.git$ cd snippets/OutOfMemoryErrorGenerator/$ mvn package$ java -Xmx128m -Xms128m -jar target/OutOfMemoryErrorGenerator-1.0.jarException in thread "main" java.lang.OutOfMemoryError: Java heap space at pl.keyer.oome.generator.Sleepyhead(Sleepyhead.java:6) at pl.keyer.oome.generator.App.main(App.java:11) |
We can notice, that the program is still running. We will need another console to run jhat. We are using the following commands:
|
1
2
3
4
5
6
7
8
9
10
11
12
13
14
|
$ jps -l752 target/OutOfMemoryErrorGenerator-1.0.jar4480 sun.tools.jps.Jps$ jmap -dump:file=dump.map 752$ jhat -port 7401 dump.mapReading from dump.map...Dump file created Sat Jun 01 23:25:55 CEST 2013Snapshot read, resolving...Resolving 561438 objects...Chasing references, expect 112 dots................................................................................................................Eliminating duplicate references................................................................................................................Snapshot resolved.Started HTTP server on port 7401Server is ready. |
Important notes about that process:
- All commands must be executed by the same user: the java process owner
- The "expect X dots" message is not a joke. While processing bigger heap dumps one can check the number of dots there in editor to see the progress, as it can take quite a while to process such a file.
- When processing bigger dumps one must watch heap size of jhat itself. This depends on the case, but to be safe (provided with enough resources) jhat should have 2-4 times more heap size, than process heap it will diagnose. If memory size for jhat is too small it will just crush after using it and the process will need to be repeated with bigger amount of memory. For example to provide jhat with 4 gigs the command will be:
1$ jhat -port7401-J-mx4G dump.map - Diagnosed process may be terminated after dumping heap with jmap.
- Obviously jhat can be run on any machine where the dump will be present. On many occasions developers choose to zip the dump and move the debug process to machine more accessible for them and with enough ram.
After executing the commands we can visit http://localhost:7401/
When facing with jhat You will quickly realize that this tool is from times, where such tools were designed without consideration of prettiness or usability. This tutorial will show how to navigate it in most cases - all it's features are cool and necessary, but everyday programmer will use only subset of them to quickly diagnose where the OOME came from.
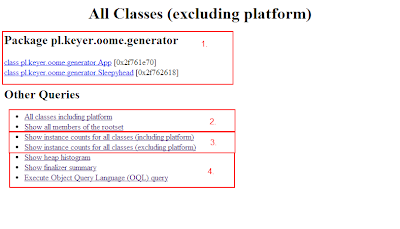
jhat main page can be divided into sections:
- List of all classes in your program (excluding platform - that is, all that is not from standard library). This list is normally really long and in most cases it is not necessary. Normally You will scroll down to "Other Queries" section right away.
- More options for listing classes
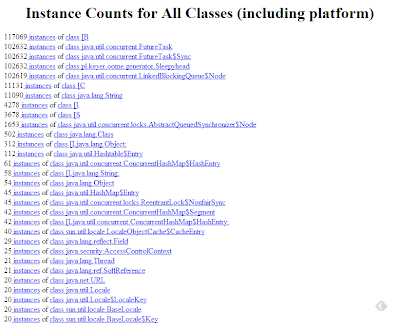
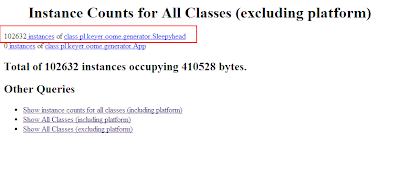
- Bread and butter of memory debugging, we will use them in a moment
- More tools for debugging, but not as helpfull as section 3.
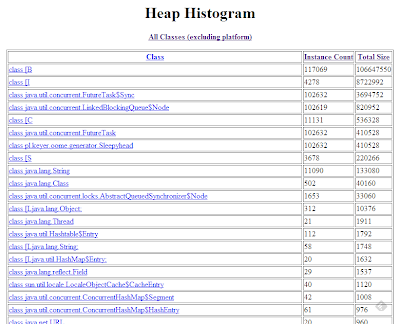
- Heap histogram is sometimes useful to compare quantity vs size of objects
- When you become jhat ninja, you sometimes could use OQL to diagnose the application. It is a SQL-like language for searching heap and calculating it's statistics.
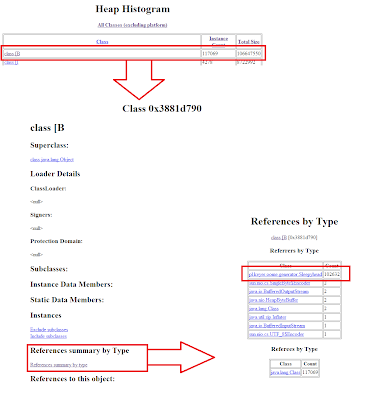
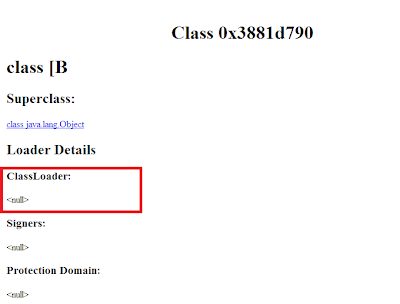
http://localhost:7401/class/0x3881d790
so the reference by type summery will have url as follow:
http://localhost:7401/refsByType/0x3881d790
