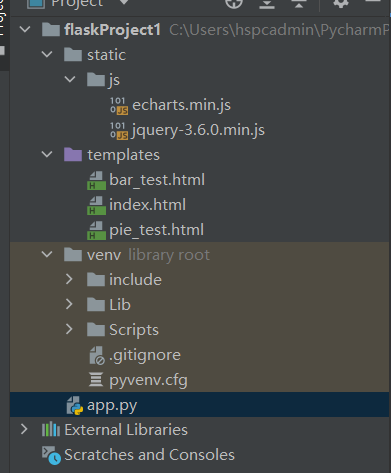
项目结构

app.py
from flask import render_template, url_for
from flask import Flask
import pymysql

app = Flask(__name__)

@app.route('/')
def index():
    return render_template('index.html')
@app.route('/pie')
def pie():
    results = []
    connection = pymysql.connect(
        host='***.***.***.***',
        user='***',
        passwd='***',
        db='***',
        port=3306,
        charset='utf8')
    cur = connection.cursor()
    sql = 'select b.MS,COUNT(*) num from Bond_IssueNew a,CT_SystemConst b WHERE a.BondNature=b.DM AND b.LB=1243 group by a.BondNature;'
    cur.execute(sql)
    results = cur.fetchall()
    print(results)
    return render_template('pie_test.html', results=results)

@app.route('/bar')
def bar():
    results = []
    connection = pymysql.connect(
        host='***.***.***.***',
        user='***',
        passwd='***',
        db='***',
        port=3306,
        charset='utf8')
    cur = connection.cursor()
    sql = 'select b.MS,COUNT(*) num from Bond_IssueNew a,CT_SystemConst b WHERE a.BondNature=b.DM AND b.LB=1243 group by a.BondNature;'
    cur.execute(sql)
    results = cur.fetchall()
    print(results)
    return render_template('bar_test.html', results=results)


if __name__ == '__main__':
    app.run(debug=True)
pie_test.html
<!DOCTYPE html>
<html lang="en">
<head>
    <meta charset="UTF-8">
    <title>Test</title>
    <script src="../static/js/echarts.min.js"></script>
    <script  src="../static/js/jquery-3.6.0.min.js"></script>
</head>
<body>
<div id="main" style="1300px;height:600px;"></div>
<script type="text/javascript">
    var chart = echarts.init(document.getElementById('main'))
    option = {
      title: {
        text: 'Referer of a Website',
        subtext: 'Fake Data',
        left: 'center'
      },
      tooltip: {
        trigger: 'item'
      },
      legend: {
        orient: 'vertical',
        left: 'left'
      },
      series: [
        {
          name: 'Access From',
          type: 'pie',
          radius: '50%',
          data: [{% for i in results %}
            { value: {{ i[1] }}, name: '{{i[0]}}'},
            {% endfor %}
          ],
          emphasis: {
            itemStyle: {
              shadowBlur: 10,
              shadowOffsetX: 0,
              shadowColor: 'rgba(0, 0, 0, 0.5)'
            }
          }
        }
      ]
    };


    chart.setOption(option);

</script>
</body>
</html>
bar_test.html
<!DOCTYPE html>
<html lang="en">
<head>
    <meta charset="UTF-8">
    <title>Test</title>
    <script src="../static/js/echarts.min.js"></script>
    <script  src="../static/js/jquery-3.6.0.min.js"></script>
</head>
<body>
<div id="main" style="1300px;height:600px;"></div>
<script type="text/javascript">
    var chart = echarts.init(document.getElementById('main'))
    option = {
      tooltip: {
        trigger: 'axis',
        axisPointer: {
          type: 'shadow'
        }
      },
      grid: {
        left: '3%',
        right: '4%',
        bottom: '3%',
        containLabel: true
      },
      xAxis: [
        {
          type: 'category',
          data: [{% for i in results %}'{{ i[0] }}', {% endfor %}],
          axisTick: {
            alignWithLabel: true
          }
        }
      ],
      yAxis: [
        {
          type: 'value'
        }
      ],
      series: [
        {
          name: '发行只数',
          type: 'bar',
          barWidth: '60%',
          data: [{% for i in results %}{{ i[1] }}, {% endfor %}]
        }
      ]
    };


    chart.setOption(option);

</script>
</body>
</html>
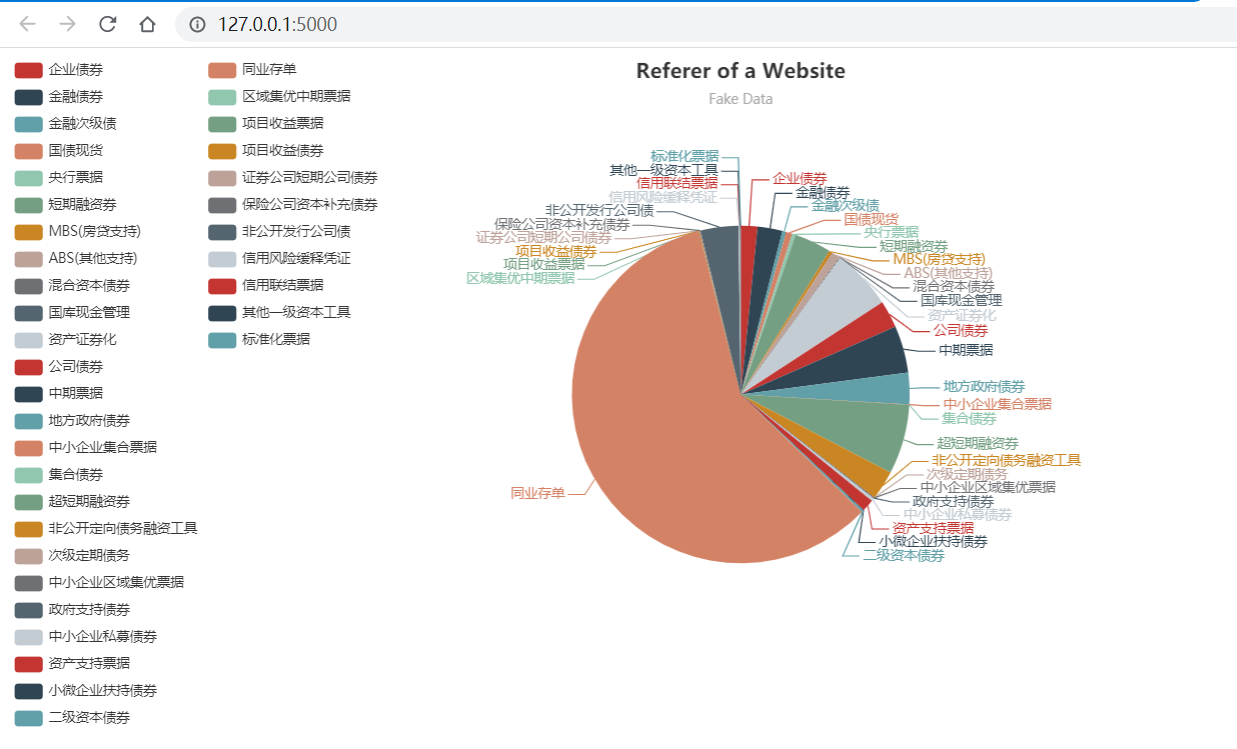
饼图

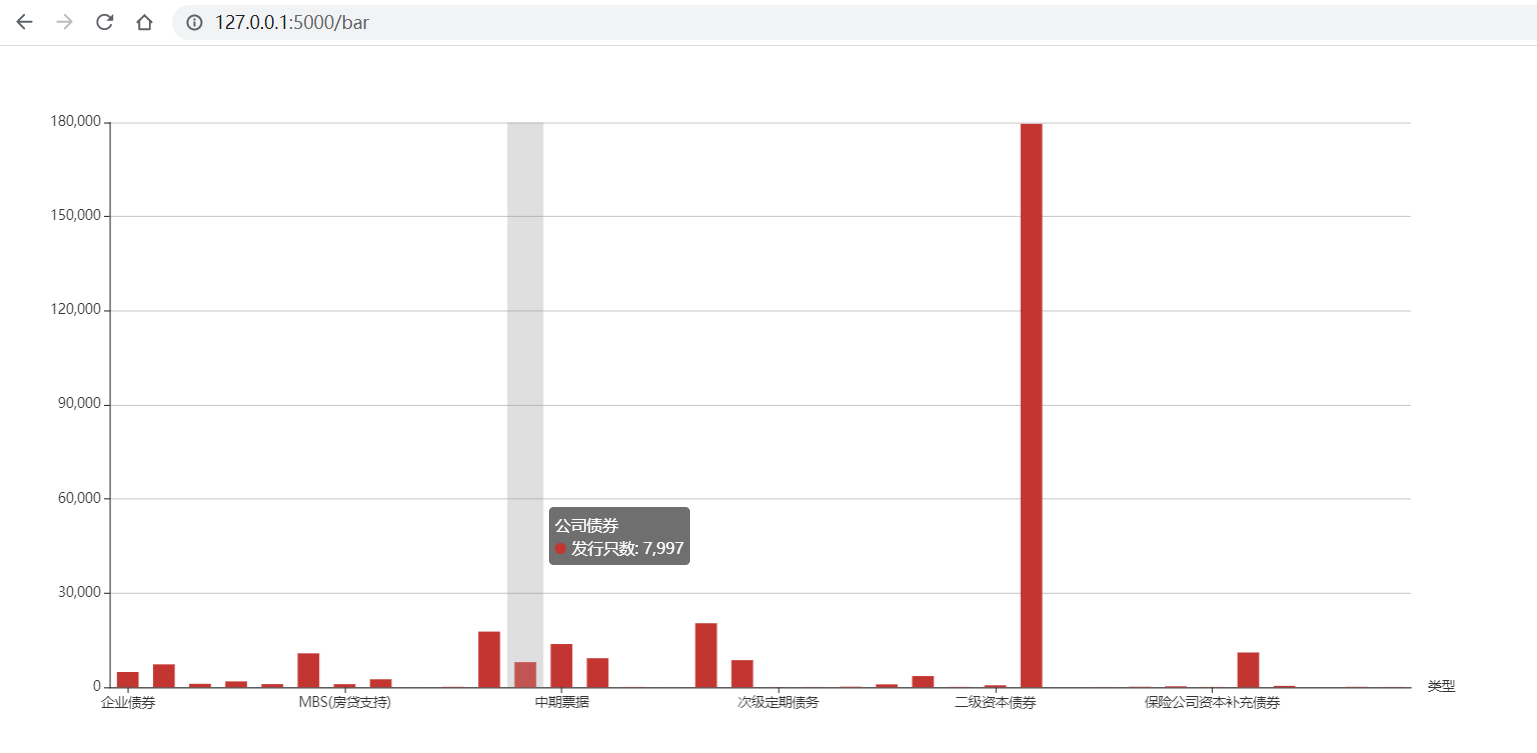
柱形图
