https://www.nsnam.org/wiki/PyViz
Introduction
NS-3 PyViz is a live simulation visualizer, meaning that it uses no trace files. It can be most useful for debugging purposes, i.e. to figure out if mobility models are what you expect, where packets are being dropped, etc. There's also a builtin interactive python console that can be used to debug the state of the running objects. Although it is mostly written in Python, it works both with Python and pure C++ simulations.
Installation
current ns-3
PyViz has been integrated into mainline ns-3, starting with version 3.10. For earlier versions, see the section below.
You will need to have certain python modules installed. Following installation instructions (for Ubuntu/Debian):
sudo apt-get install python-dev python-pygraphviz python-kiwi python-pygoocanvas
                     python-gnome2 python-gnomedesktop python-rsvg
Optionally, you may install Interactive Python in order to have a Console button in the visualizer GUI:
sudo apt-get install ipython
On Fedora/RedHat, do:
yum install python-devel gnome-python2 gnome-python2-gnomedesktop gnome-python2-rsvg graphviz-python pygoocanvas python-kiwi
On OS X, you need to install the pygtk, pygoocanvas, and pygraphviz packages. The specific package names depend on which version of python you are using and which package manager is being used for Python packages (default MacPython, or MacPorts, or Homebrew, or pip). Note that ns-3 (as of ns-3.22) is only compatible with Python 2.7 or older, not Python 3.
For example, using MacPorts and python27, the following additional package installations made PyViz available on an OS X Yosemite machine:
port install py27-pygtk py27-pygoocanvas py27-pygraphviz
Configure and build your ns-3 tree as usual, and make sure NS-3 Python bindings are enabled; pyviz will not work without Python bindings!
You can test the visualizer for example with the FlowMonitor sample program:
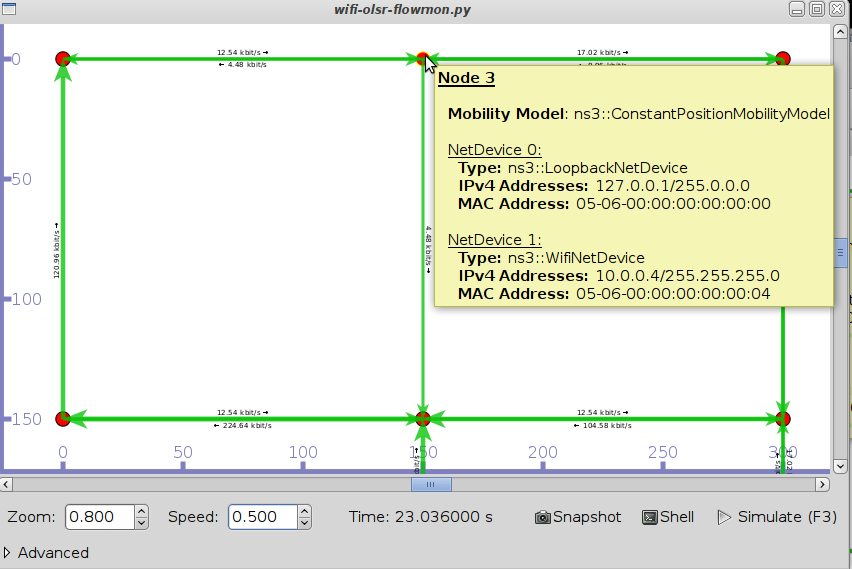
./waf --pyrun src/flow-monitor/examples/wifi-olsr-flowmon.py --vis
And the result should be something similar to the screenshot below:
ns versions < 3.10
For earlier ns-3 versions, PyViz is found on a separate branch. There are multiple branches of PyViz, merged with different versions of NS-3:
- gjc/ns-3-pyviz: this branch is based on the old NS-3.2 version;
- gjc/ns-3.7-pyviz: this branch is based on NS-3.7
- gjc/ns-3.8-pyviz: this branch is based on NS-3.8
- gjc/ns-3.9-pyviz: this branch is based on NS-3.9
- gjc/ns-3-pyviz-dev: this branch was based on the current NS-3 development version, ns-3-dev, but seems to be no longer maintained.
You will have to select one of those branches, and merge it with your code.
Enabling the visualizer in your own simulation
current ns-3
In ns version 3.11 and later, you first need to add the 'visualizer' module to your program, as a dependency. Note: "scratch" programs do not need this step, they already link to the visualizer module by default.
For non-scratch programs, find the wscript that declares the program, and modify it, such as:
diff -r fbeb6b1cca20 src/olsr/examples/wscript
--- a/src/olsr/examples/wscript	Thu Jun 02 09:21:24 2011 -0700
+++ b/src/olsr/examples/wscript	Fri Jun 03 11:25:14 2011 +0100
@@ -2,7 +2,7 @@

 def build(bld):
     obj = bld.create_ns3_program('simple-point-to-point-olsr',
-                                 ['point-to-point', 'internet', 'olsr', 'applications', 'wifi'])
+                                 ['point-to-point', 'internet', 'olsr', 'applications', 'wifi', 'visualizer'])
     obj.source = 'simple-point-to-point-olsr.cc'

     obj = bld.create_ns3_program('olsr-hna',
Then activating the visualizer is a matter of enable the --vis waf option:
./waf --run myprogram --vis
Note: the --vis option only works if the program uses ns3::CommandLine to parse command-line arguments:
main(int argc, char *argv[])
{
   [...]
   CommandLine cmd;
   cmd.Parse (argc, argv);
   [...]
   Simulator::Run ();
 }
For Python scripts, you have to import the 'ns.visualizer' module. And also use CommandLine:
import ns.core
import ns.visualizer
[...]
cmd = ns.core.CommandLine()
cmd.Parse(sys.argv)
[...]
ns.core.Simulator.Run()
ns 3.10
For Python simulations, there is an API to start the visualizer. You have to import the visualizer module, and call visualizer.start() instead of ns3.Simulator.Run(). For C++ simulations, there is no API. For C++ simulations (but also works for Python ones) you need to set the GlobalValue SimulatorImplementationType to "ns3::VisualSimulatorImpl". This can be set from the command-line, for example (add the --SimulatorImplementationType=ns3::VisualSimulatorImpl option), or via the waf option --visualize, in addition to the usual --run option to run programs.
ns before 3.10
For Python simulations, you have to import the visualizer module, and call visualizer.start() instead of ns3.Simulator.Run(). For example, like this.
For C++ simulations, #include "ns3/visualizer.h", and replace the call to Simulator::Run (); with Visualizer::Run ();. For example, like this.
Usage Tips
The mouse controls work as follows:
- Middle button drag:
- Over a Node, drags the Node around (calls SetPosition on the mobility model of the node, beware the certain mobility models have bounds and crash if the bounds are not respected);
- Over the background: scroll the view;
- First button: select a Node, if over the node;
- Scroll wheel: zoom in/out
In the shell, a couple of variables are defined:
- 'viz': the visualizer python class, which has some useful methods;
- 'selected_node': the currently selected NS-3 node.
Known problems
LTE devices do not support visualizer yet.
You cannot use visualizer with simulations that require emulation (EmuNetDevice, TapNetDevice) or real-time scheduler (RealTimeSimulator).
Plugins
Warning: This section may contain dated information for ns-3 version < 3.10. Updated information is requested.
Before proceeding, be sure you know how to program in PyGTK. Depending on what you want to do, GooCanvas knowledge may also be required.
Python modules or packages appearing in contrib/visualizer/plugins/ are loaded automatically by pyviz as plugins. Each plugin module must define a register(viz) function, that is called as soon as the visualizer is initialized, passing the Visualizer class instance as sole argument.
The Visualizer class is a singleton that controls the whole visualizer GUI. It contains a list of nodes and channels, the canvas (goocanvas.Canvas), a list of arrows used to represent the packet transmissions, and assorted GUI elements, like the play/pause button.
Plugins typically connect to a set of "signals" (for more information about signals visit the pygtk documentation):
The populate-node-menu signal may be used to add options to the right-click popup menu of nodes:
           # signal emitted whenever a right-click-on-node popup menu is being constructed
           'populate-node-menu': (gobject.SIGNAL_RUN_LAST, None, (object, gtk.Menu,)),
simulation-periodic-update is called periodically as the simulation progresses:
           # signal emitted after every simulation period (SAMPLE_PERIOD seconds of simulated time)
           # the simulation lock is acquired while the signal is emitted
           'simulation-periodic-update': (gobject.SIGNAL_RUN_LAST, None, ()),
topology-scanned is called only once when the topology is scanned:
           # signal emitted right after the topology is scanned
           'topology-scanned': (gobject.SIGNAL_RUN_LAST, None, ()),
update-view is called periodically after the view is updated by pyviz, to allow plugins to add additional visualization elements:
           # signal emitted when it's time to update the view objects
           'update-view': (gobject.SIGNAL_RUN_LAST, None, ()),
There is class named InformationWindow. Plugins may create such a window to display some information regarding the simulation state. The programmer must subclass InformationWindow and implement the method update(), which will be called periodically as the simulation
progresses, and which would typically extract simulation state information and present it in the window.
Internal Desgin
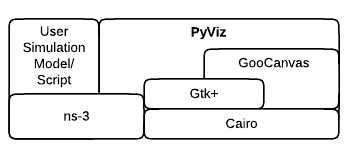
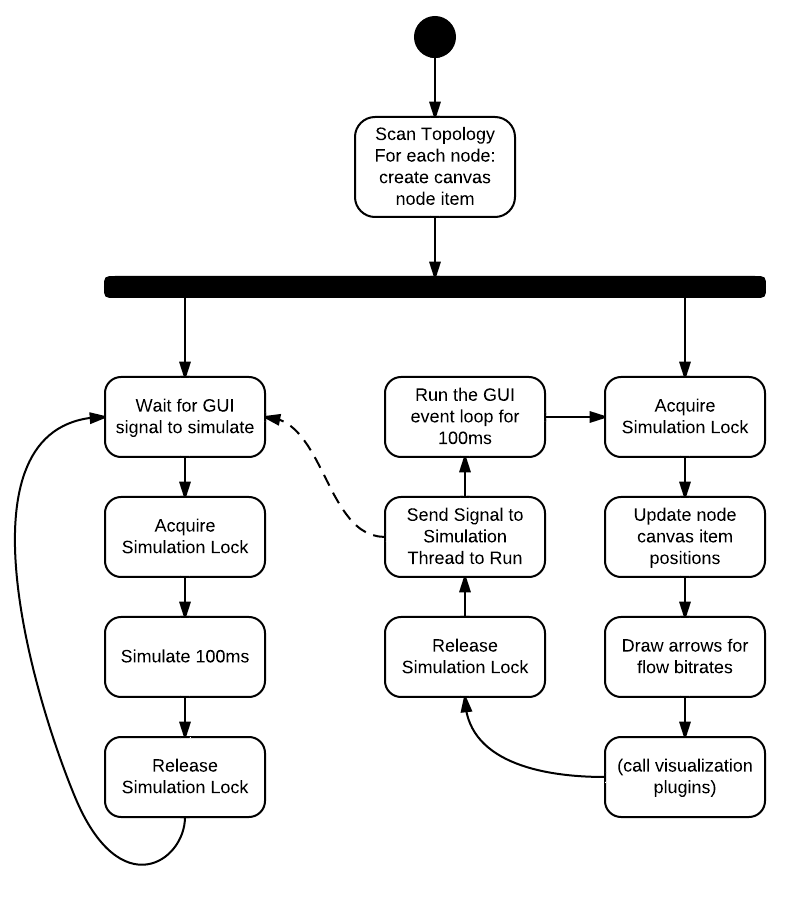
PyViz uses Gtk+ and GooCanvas for the GUI part, and also accesses the ns-3 API directly, all via respective Python bindings.
It then runs two threads: in the main thread, the GUI is kept updated, in a separate thread the simulation is run. Updates happen in slices of 100 ms.


