直接用matlab了。
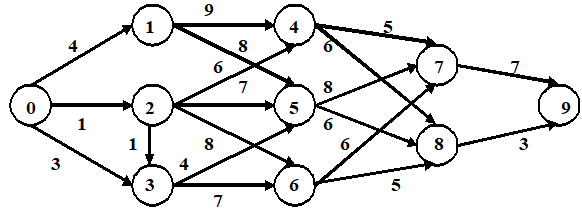
W = [ 4 1 3 9 8 1 6 7 8 4 7 5 6 8 6 6 5 7 3];
S = [ 0 0 0 1 1 2 2 2 2 3 3 4 4 5 5 6 6 7 8];S=S+1;
T = [ 1 2 3 4 5 3 4 5 6 5 6 7 8 7 8 7 8 9 9];T=T+1;
IDS={'u0','u1','u2','u3','u4','u5','u6','u7','u8','u9'};
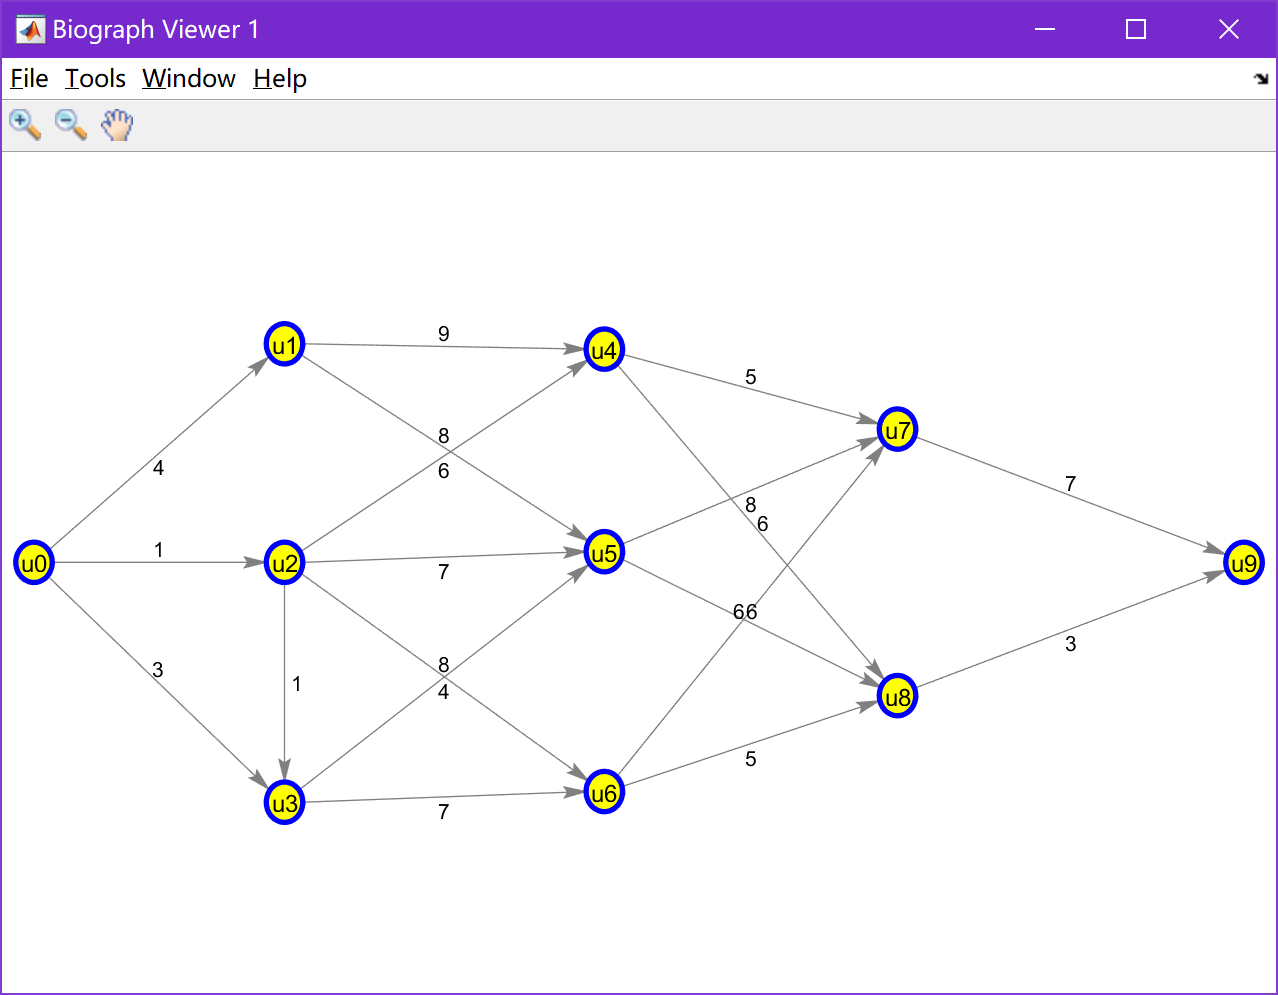
DG = sparse(S,T,W,10,10);%求稀疏矩阵
bg=biograph(DG,IDS,'ShowArrows','on','ShowWeights','on');%构建biograph对象,设置参数
set(bg.nodes,'shape','circle','color',[1,1,0],'linecolor',[0,0,1]);
set(bg.nodes,'textColor',[0,0,0],'lineWidth',2,'fontsize',9);
set(bg,'EdgeType','straight');%设置连线为直线
get(bg.nodes,'position');%获取节点位置
dolayout(bg);
bg.nodes(1).position=[6,100];
bg.nodes(2).position=[100,182];
bg.nodes(3).position=[100,100];
bg.nodes(4).position=[100,10];
bg.nodes(5).position=[220,180];
bg.nodes(6).position=[220,104];
bg.nodes(7).position=[220,14];
bg.nodes(8).position=[330,150];
bg.nodes(9).position=[330,50];
bg.nodes(10).position=[460,100];
dolayout(bg,'pathsonly',true);
t = view(bg)
[dist,path,pred] = graphshortestpath(DG,1,10,'directed',true)%Dijkstra求最短路
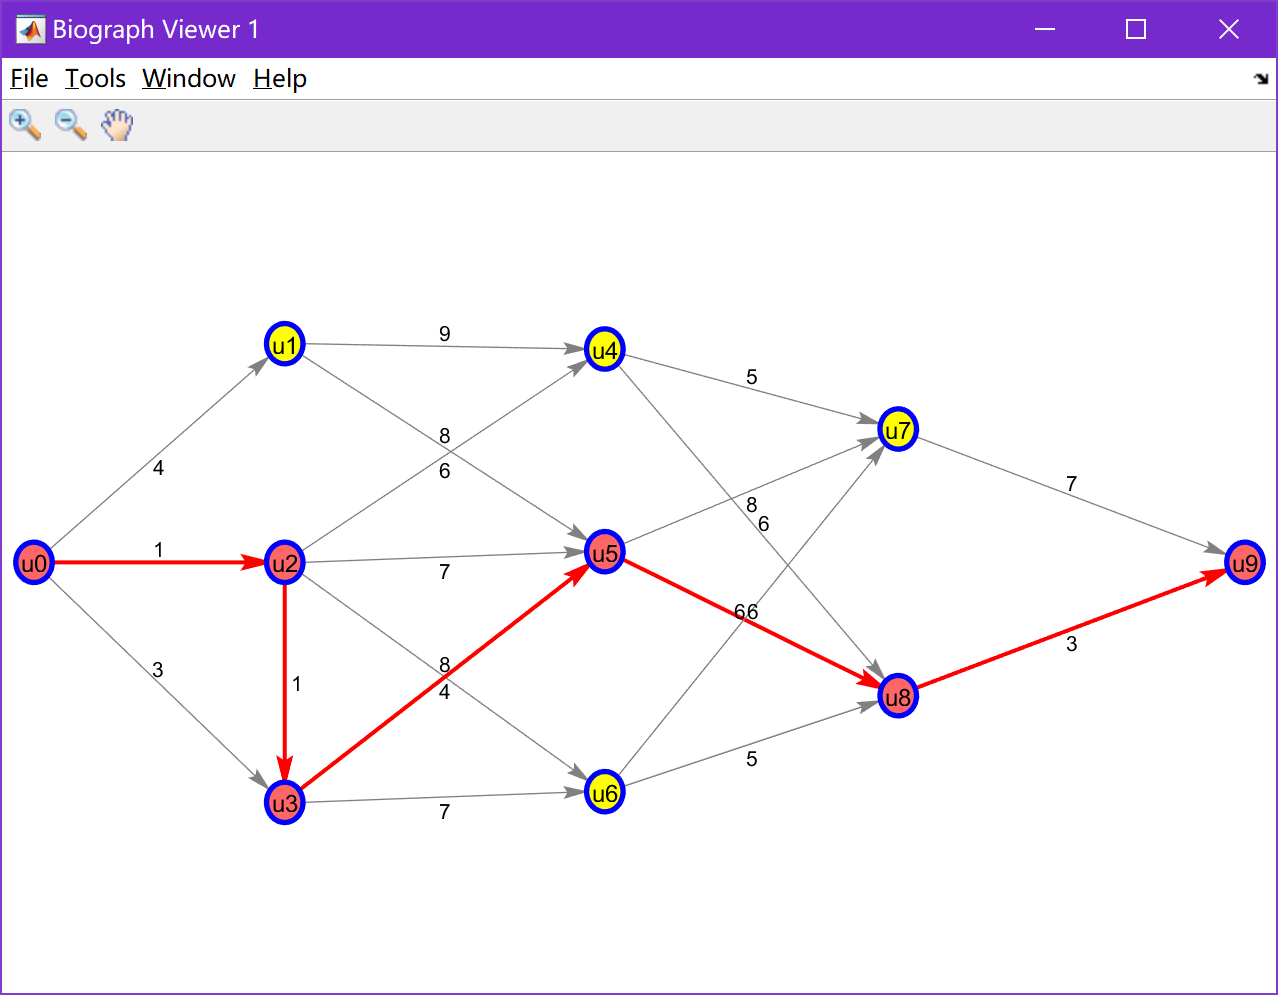
这是多加了条显示路径的语句,就是更好看些了:
W = [ 4 1 3 9 8 1 6 7 8 4 7 5 6 8 6 6 5 7 3];
S =  [ 0 0 0 1 1 2 2 2 2 3 3 4 4 5 5 6 6 7 8];S=S+1;
T =  [ 1 2 3 4 5 3 4 5 6 5 6 7 8 7 8 7 8 9 9];T=T+1;
IDS={'u0','u1','u2','u3','u4','u5','u6','u7','u8','u9'};
DG = sparse(S,T,W,10,10);%求稀疏矩阵
bg=biograph(DG,IDS,'ShowArrows','on','ShowWeights','on');%构建biograph对象,设置参数
set(bg.nodes,'shape','circle','color',[1,1,0],'linecolor',[0,0,1]);
set(bg.nodes,'textColor',[0,0,0],'lineWidth',2,'fontsize',9);
set(bg,'EdgeType','straight');%设置连线为直线
get(bg.nodes,'position');%获取节点位置
dolayout(bg);
bg.nodes(1).position=[6,100];
bg.nodes(2).position=[100,182];
bg.nodes(3).position=[100,100];
bg.nodes(4).position=[100,10];
bg.nodes(5).position=[220,180];
bg.nodes(6).position=[220,104];
bg.nodes(7).position=[220,14];
bg.nodes(8).position=[330,150];
bg.nodes(9).position=[330,50];
bg.nodes(10).position=[460,100];
dolayout(bg,'pathsonly',true);
[dist,path,pred] = graphshortestpath(DG,1,10,'directed',true)%Dijkstra求最短路
set(bg.nodes(path),'Color',[1 0.4 0.4])
edges=getedgesbynodeid(bg,get(bg.Nodes(path),'ID'));
set(edges,'LineColor',[1 0 0])
set(edges,'LineWidth',1.5)
t = view(bg)