一 变分自编码(Variational Auto-Encoder)
变分自编码不再是学习样本的个体,而是学习样本的规律,这样训练出来的自编码不单具有重构样本的功能,还具有仿照样本的功能。
变分自编码,其实就是在编码过程中改变了样本的分布("变分"可以理解为改变分布)。前面所说的"学习样本的规律",具体指的就是样本的分布,假设我们知道样本的分布函数,就可以从这个函数中随便的取一个样本,然后进行网络解码层向前传导,这样就可以生成一个新的样本。
为了得到这个样本的分布函数,模型训练的目的不再是样本本身,而是通过加一个约束项,将网络生成一个服从于高斯分布的数据集,这样按照高斯分布里的均值和方差规则就可以任意取相关的数据,然后通过解码层还原成样本。我们先来看一下VAE的结构框图,后面来介绍一下VAE的原理:

二 分布变换
我们希望构建一个隐层变量Z生成目标数据X的模型,但是实现上有所不同。更准确地讲,它们是假设了Z服从某些常见的分布(比如正态分布或均匀分布),然后希望训练一个模型X=g(Z),这个模型能够将原来的的概率分布映射到训练集的概率分布,也就是说,它们的目的都是进行分布之间的变换。

那现在假设Z服从标准的正态分布,就可以从中采样得到若干个Z1,Z2,…,Zn,然后对它做变换得到X^1=g(Z1),X^2=g(Z2),…,X^n=g(Zn),我们怎么判断这个通过f构造出来的数据集,它的分布跟我们目标的数据集分布是不是一样的呢?有读者说不是有KL散度吗?当然不行,因为KL散度是根据两个概率分布的表达式来算它们的相似度的,然而目前我们并不知道它们的概率分布的表达式,我们只有一批从构造的分布采样而来的数据{X^1,X^2,…,X^n},还有一批从真实的分布采样而来的数据{X1,X2,…,Xn}(也就是我们希望生成的训练集)。我们只有样本本身,没有分布表达式,当然也就没有方法算KL散度。生成模型的难题就是判断生成分布与真实分布的相似度,因为我们只知道两者的采样结果,不知道它们的分布表达式。虽然遇到困难,但还是要想办法解决的。VAE使用了一个精致迂回的技巧。
三 VAE慢谈
这一部分我们先回顾一般教程是怎么介绍VAE的,然后再探究有什么问题,接着就自然地发现了VAE真正的面目。
1.经典回顾
首先我们有一批数据样本{X1,…,Xn},其整体用X来描述,我们本想根据{X1,…,Xn}得到X的分布p(X),如果能得到的话,那我直接根据p(X)来采样,就可以得到所有可能的X了,这是一个终极理想的生成模型了。当然,这个理想很难实现,于是我们将分布改一改:

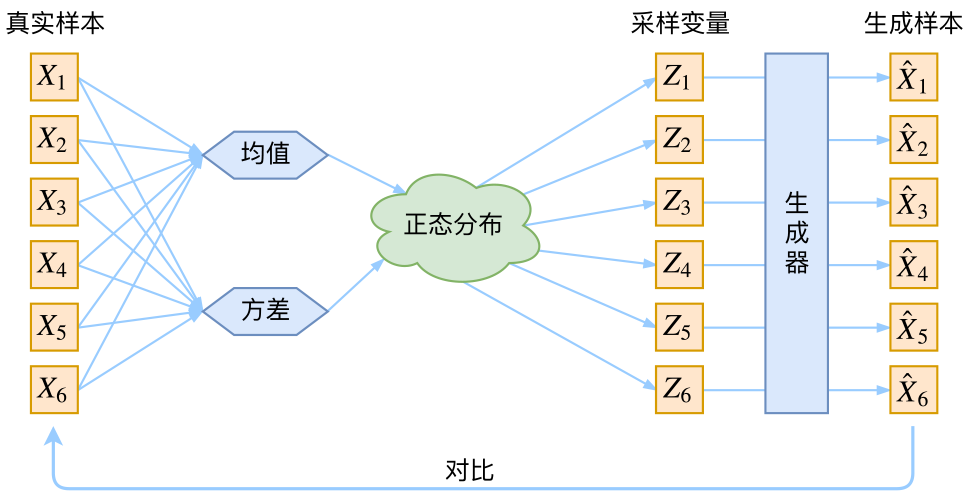
这里我们就不区分求和还是求积分了,意思对了就行。此时p(X|Z)就描述了一个由Z来生成X的模型,而我们假设Z服从标准正态分布,也就是p(Z)=N(0,I)。如果这个理想能实现,那么我们就可以先从标准正态分布中采样一个Z,然后根据Z来算一个X,也是一个很棒的生成模型。接下来就是结合自编码器来实现重构,保证有效信息没有丢失,再加上一系列的推导,最后把模型实现。框架的示意图如下:
看出了什么问题了吗?如果像这个图的话,我们其实完全不清楚:究竟经过重新采样出来的Zk,是不是还对应着原来的Xk,所以我们如果直接最小化D(X^k,Xk)2这里D代表某种距离函数)是很不科学的,而事实上你看代码也会发现根本不是这样实现的。也就是说,很多教程说了一大通头头是道的话,然后写代码时却不是按照所写的文字来写,可是他们也不觉得这样会有矛盾。
2.VAE初现
其实,在整个VAE模型中,我们并没有去使用p(Z)(先验分布)是正态分布的假设,我们用的是假设p(Z|X)(后验分布)是正态分布!!
具体来说,给定一个真实样本Xk,我们假设存在一个专属于Xk的分布p(Z|Xk)(学名叫后验分布),并进一步假设这个分布是(独立的、多元的)正态分布。为什么要强调“专属”呢?因为我们后面要训练一个生成器X=g(Z),希望能够把从分布p(Z|Xk)采样出来的一个Zk还原为Xk。如果假设p(Z)是正态分布,然后从p(Z)中采样一个Z,那么我们怎么知道这个Z对应于哪个真实的X呢?现在p(Z|Xk)专属于Xk,我们有理由说从这个分布采样出来的Z应该要还原到Xk中去。
事实上,在论文《Auto-Encoding Variational Bayes》的应用部分,也特别强调了这一点:
In this case, we can let the
variational approximate posterior be a multivariate Gaussian with a diagonal covariance structure:(注:这里是直接摘录原论文,本文所用的符号跟原论文不尽一致,望读者不会混淆。)
论文中的式(9)是实现整个模型的关键,不知道为什么很多教程在介绍VAE时都没有把它凸显出来。尽管论文也提到p(Z)是标准正态分布,然而那其实并不是本质重要的。
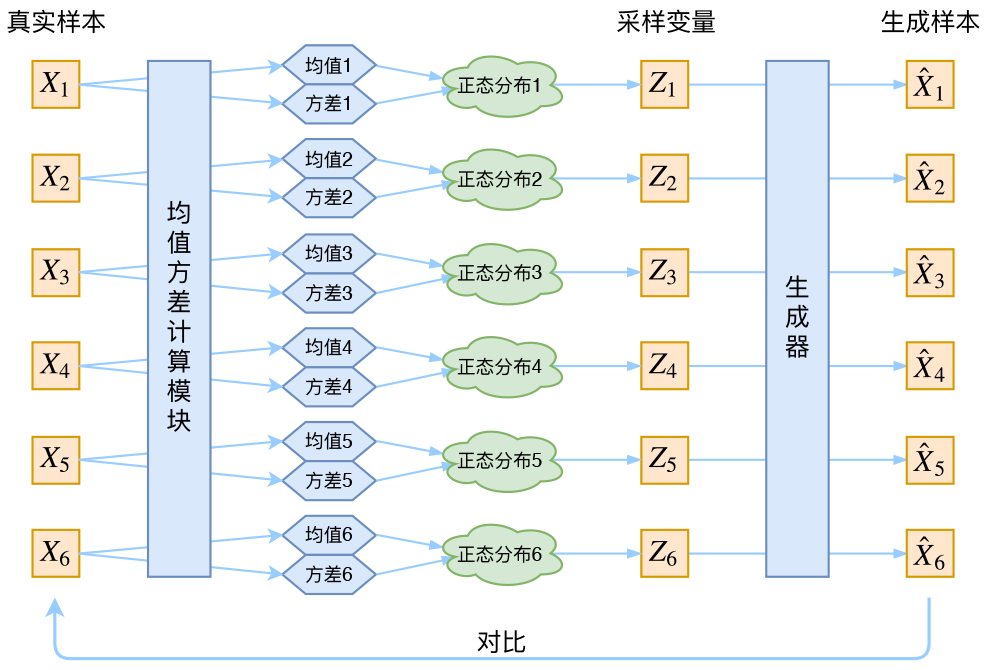
回到本文,这时候每一个Xk都配上了一个专属的正态分布,才方便后面的生成器做还原。但这样有多少个X就有多少个正态分布了。我们知道正态分布有两组参数:均值μ和方差σ2(多元的话,它们都是向量),那我怎么找出专属于Xk的正态分布p(Z|Xk)的均值和方差呢?好像并没有什么直接的思路。那好吧,那我就用神经网络来拟合出来吧!
于是我们构建两个神经网络μk=f1(Xk),logσ2=f2(Xk)来算它们了。我们选择拟合logσ2而不是直接拟合σ2,是因为σ2总是非负的,需要加激活函数处理,而拟合logσ2不需要加激活函数,因为它可正可负。到这里,我能知道专属于Xk的均值和方差了,也就知道它的正态分布长什么样了,然后从这个专属分布中采样一个Zk出来,然后经过一个生成器得到X^k=g(Zk),现在我们可以放心地最小化D(X^k,Xk)2,因为Zk是从专属Xk的分布中采样出来的,这个生成器应该要把开始的Xk还原回来。于是可以画出VAE的示意:
事实上,VAE是为每个样本构造专属的正态分布,然后采样来重构。
3.分布标准化
让我们来思考一下,根据上图的训练过程,最终会得到什么结果。
首先,我们希望重构X,也就是最小化D(X^k,Xk)2,但是这个重构过程受到噪声的影响,因为Zk是通过重新采样过的,不是直接由encoder算出来的。显然噪声会增加重构的难度,不过好在这个噪声强度(也就是方差)通过一个神经网络算出来的,所以最终模型为了重构得更好,肯定会想尽办法让方差为0。而方差为0的话,也就没有随机性了,所以不管怎么采样其实都只是得到确定的结果(也就是均值),只拟合一个当然比拟合多个要容易,而均值是通过另外一个神经网络算出来的。
说白了,模型会慢慢退化成普通的AutoEncoder,噪声不再起作用。
这样不就白费力气了吗?说好的生成模型呢?
别急别急,其实VAE还让所有的p(Z|X)都向标准正态分布看齐,这样就防止了噪声为零,同时保证了模型具有生成能力。怎么理解“保证了生成能力”呢?如果所有的p(Z|X)都很接近标准正态分布N(0,I),那么根据定义:

这样我们就能达到我们的先验假设:p(Z)是标准正态分布。然后我们就可以放心地从N(0,I)中采样来生成图像了。
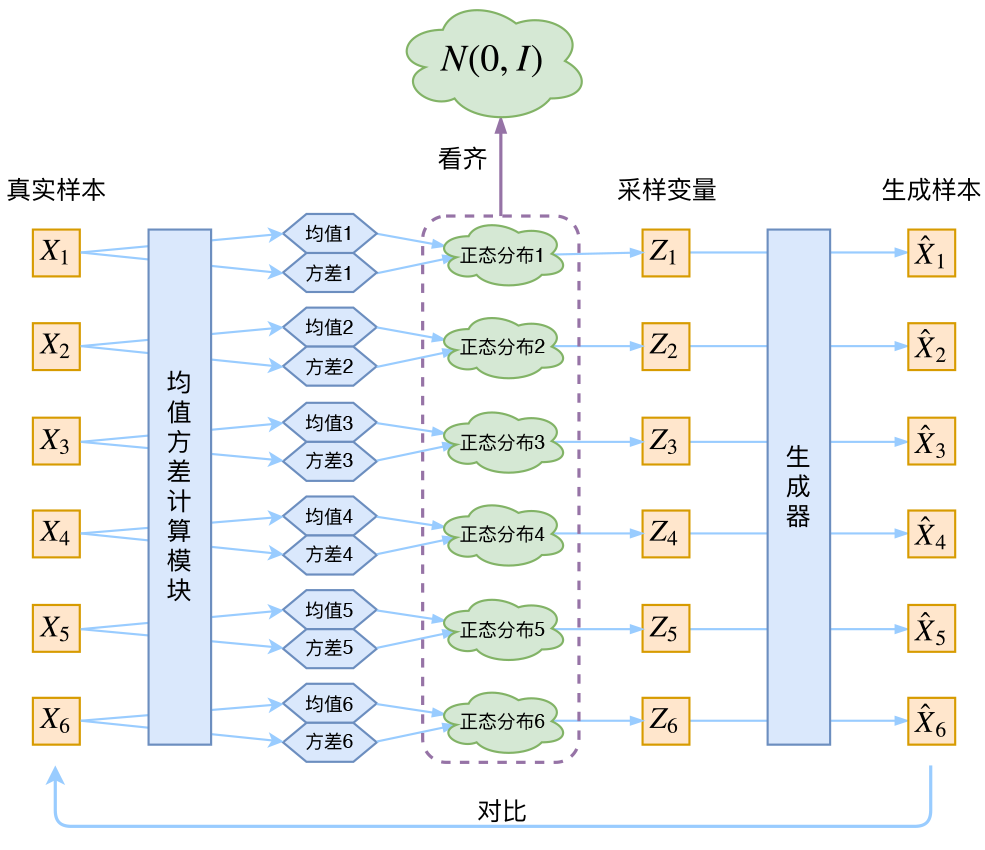
为了使模型具有生成能力,VAE要求每个p(Z|X)都向正态分布看齐。
那怎么让所有的p(Z|X)都向N(0,I)看齐呢?如果没有外部知识的话,其实最直接的方法应该是在重构误差的基础上中加入额外的loss:

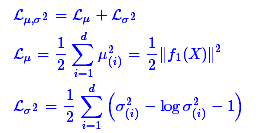
因为它们分别代表了均值μk和方差的对数logσ2,达到N(0,I)就是希望二者尽量接近于0了。不过,这又会面临着这两个损失的比例要怎么选取的问题,选取得不好,生成的图像会比较模糊。所以,原论文直接算了一般(各分量独立的)正态分布与标准正态分布的KL散度KL(N(μ,σ2)||N(0,I))作为这个额外的loss,计算结果为:

这里的d是隐变量Z的维度,而μ(i)和σ2分别代表一般正态分布的均值向量和方差向量的第i个分量。直接用这个式子做补充loss,就不用考虑均值损失和方差损失的相对比例问题了。显然,这个loss也可以分两部分理解:
推导
由于我们考虑的是各分量独立的多元正态分布,因此只需要推导一元正态分布的情形即可,根据定义我们可以写出:
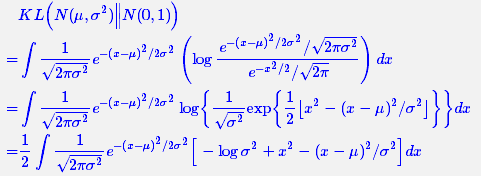
整个结果分为三项积分,第一项实际上就是−logσ2乘以概率密度的积分,所以结果是-logσ2;第二项实际是正态分布的二阶矩,熟悉正态分布的朋友应该都清楚正态分布的二阶矩为μ2+σ2;而根据定义,第三项实际上就是“-方差除以方差=-1”。所以总结果就是:

4重要参数技巧
最后是实现模型的一个技巧,英文名是reparameterization trick,我这里叫它做重参数吧。其实很简单,就是我们要从p(Z|Xk)中采样一个Zk出来,尽管我们知道了p(Z|Xk)是正态分布N(μ,σ2),但我们应该从 N(μ,σ2)采样,但这个采样操作对 μ和 σ2是不可导的,导致常规的通过误差反传的梯度下降法(GD)不能使用。“采样”这个操作是不可导的,但是采样的结果是可导的。我们利用:
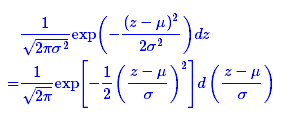
这说明(z−μ)/σ=ε是服从均值为0、方差为1的标准正态分布的,要同时把dz考虑进去,是因为乘上dz才算是概率,去掉dz是概率密度而不是概率。这时候我们得到:
从N(μ,σ2)中采样一个Z,相当于从N(0,I)中采样一个ε,然后让Z=μ+ε×σ。
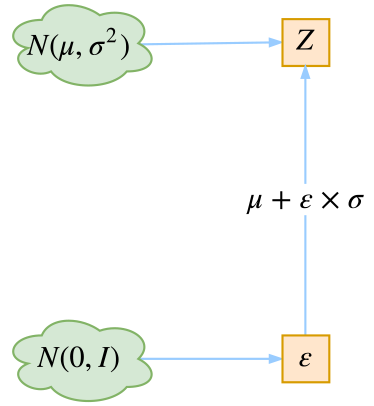
于是,我们将从N(μ,σ2)采样变成了从N(0,I)中采样,然后通过参数变换得到从N(μ,σ2)中采样的结果。这样一来,“采样”这个操作就不用参与梯度下降了,改为采样的结果参与,使得整个模型可训练了。
四 VAE的本质
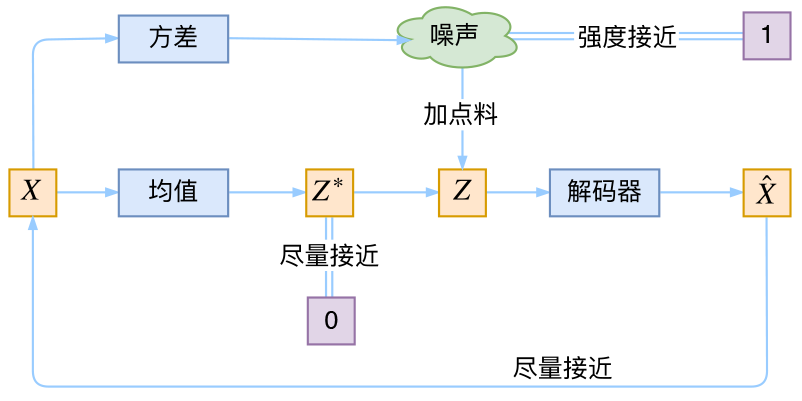
VAE的本质是什么?VAE虽然也称是AE(AutoEncoder)的一种,但它的做法(或者说它对网络的诠释)是别具一格的。在VAE中,它的Encoder有两个,一个用来计算均值,一个用来计算方差,这已经让人意外了:Encoder不是用来Encode的,是用来算均值和方差的,这真是大新闻了,还有均值和方差不都是统计量吗,怎么是用神经网络来算的?
事实上,我觉得VAE从让普通人望而生畏的变分和贝叶斯理论出发,最后落地到一个具体的模型中,虽然走了比较长的一段路,但最终的模型其实是很接地气的:它本质上就是在我们常规的自编码器的基础上,对encoder的结果(在VAE中对应着计算均值的网络)加上了“高斯噪声”,使得结果decoder能够对噪声有鲁棒性;而那个额外的KL loss(目的是让均值为0,方差为1),事实上就是相当于对encoder的一个正则项,希望encoder出来的东西均有零均值。
那另外一个encoder(对应着计算方差的网络)的作用呢?它是用来动态调节噪声的强度的。直觉上来想,当decoder还没有训练好时(重构误差远大于KL loss),就会适当降低噪声(KL loss增加),使得拟合起来容易一些(重构误差开始下降);反之,如果decoder训练得还不错时(重构误差小于KL loss),这时候噪声就会增加(KL loss减少),使得拟合更加困难了(重构误差又开始增加),这时候decoder就要想办法提高它的生成能力了。
五 使用VAE模拟生成MNIST数据
1.定义占位符
该网络与之前的略有不同,编码器为两个全连接层,第一个全连接层由784个维度的输入变化256个维度的输出,第二个全连接层并列连接了两个输出网络,mean和lg_var(可以看做噪声项,VAE跟普通的自编码器差别不大,无非是多加了该噪声并对该噪声做了约束),每个网络都输出了两个维度的输出。然后两个输出通过一个公式的计算,输入到以一个2节点为开始的解码部分,接着后面为两个全连接的解码层,第一个由两个维度的输入到256个维度的输出,第二个由256个维度的输入到784个维度的输出。
import tensorflow as tf
import numpy as np
import matplotlib.pyplot as plt
from tensorflow.examples.tutorials.mnist import input_data
from scipy.stats import norm


mnist = input_data.read_data_sets('MNIST-data',one_hot=True)

print(type(mnist)) #<class 'tensorflow.contrib.learn.python.learn.datasets.base.Datasets'>

print('Training data shape:',mnist.train.images.shape)           #Training data shape: (55000, 784)
print('Test data shape:',mnist.test.images.shape)                #Test data shape: (10000, 784)
print('Validation data shape:',mnist.validation.images.shape)    #Validation data shape: (5000, 784)
print('Training label shape:',mnist.train.labels.shape)          #Training label shape: (55000, 10)

train_X = mnist.train.images
train_Y = mnist.train.labels
test_X = mnist.test.images
test_Y = mnist.test.labels


'''
定义网络参数
'''
n_input = 784
n_hidden_1 = 256
n_hidden_2 = 2
learning_rate = 0.001
training_epochs = 20               #迭代轮数
batch_size = 128                   #小批量数量大小
display_epoch = 3
show_num = 10

x = tf.placeholder(dtype=tf.float32,shape=[None,n_input])
#后面通过它输入分布数据,用来生成模拟样本数据
zinput = tf.placeholder(dtype=tf.float32,shape=[None,n_hidden_2])
2.定义学习参数
mean_w1和mean_b1是成圣mean的权重和偏置,log_sigma_w1和log_sigma_b1是生成log_sigma的权重和偏置。
'''
定义学习参数
'''
weights = {
        'w1':tf.Variable(tf.truncated_normal([n_input,n_hidden_1],stddev = 0.001)),
        'mean_w1':tf.Variable(tf.truncated_normal([n_hidden_1,n_hidden_2],stddev = 0.001)),
        'log_sigma_w1':tf.Variable(tf.truncated_normal([n_hidden_1,n_hidden_2],stddev = 0.001)),
        'w2':tf.Variable(tf.truncated_normal([n_hidden_2,n_hidden_1],stddev = 0.001)),
        'w3':tf.Variable(tf.truncated_normal([n_hidden_1,n_input],stddev = 0.001))
        }

biases = {
        'b1':tf.Variable(tf.zeros([n_hidden_1])),
        'mean_b1':tf.Variable(tf.zeros([n_hidden_2])),
        'log_sigma_b1':tf.Variable(tf.zeros([n_hidden_2])),
        'b2':tf.Variable(tf.zeros([n_hidden_1])),
        'b3':tf.Variable(tf.zeros([n_input]))
        }
注意:这里初始化权重时,使用了很小的值0.001。这里设置的非常小心,由于在算KL离散度时计算的是与标准高斯分布的距离,如果网络初始生成的模型均值和方差都很大,那么与标准高斯分布的差距就会非常大,这样会导致模型训练不出来,生成NAN的情况。
3.定义网络结构
'''
定义网络结构
'''
#第一个全连接层是由784个维度的输入样->256个维度的输出
h1 = tf.nn.relu(tf.add(tf.matmul(x,weights['w1']),biases['b1']))
#第二个全连接层并列了两个输出网络
z_mean = tf.add(tf.matmul(h1,weights['mean_w1']),biases['mean_b1'])
z_log_sigma_sq = tf.add(tf.matmul(h1,weights['log_sigma_w1']),biases['log_sigma_b1'])


#然后将两个输出通过一个公式的计算,输入到以一个2节点为开始的解码部分 高斯分布样本
eps = tf.random_normal(tf.stack([tf.shape(h1)[0],n_hidden_2]),0,1,dtype=tf.float32)
z = tf.add(z_mean,tf.multiply(tf.sqrt(tf.exp(z_log_sigma_sq)),eps))


#解码器 由2个维度的输入->256个维度的输出
h2 = tf.nn.relu(tf.matmul(z,weights['w2']) + biases['b2'])
#解码器 由256个维度的输入->784个维度的输出  即还原成原始输入数据
reconstruction = tf.matmul(h2,weights['w3']) + biases['b3']


#这两个节点不属于训练中的结构,是为了生成指定数据时用的
h2out = tf.nn.relu(tf.matmul(zinput,weights['w2']) + biases['b2'])
reconstructionout = tf.matmul(h2out,weights['w3']) + biases['b3']
4 反向传播
这里定义损失函数加入了KL散度:
'''
构建模型的反向传播
'''
#计算重建loss
#计算原始数据和重构数据之间的损失,这里除了使用平方差代价函数,也可以使用交叉熵代价函数
reconstr_loss = 0.5*tf.reduce_sum((reconstruction-x)**2)
print(reconstr_loss.shape)    #(,) 标量
#使用KL离散度的公式
latent_loss = -0.5*tf.reduce_sum(1 + z_log_sigma_sq - tf.square(z_mean) - tf.exp(z_log_sigma_sq),1)
print(latent_loss.shape)      #(128,)
cost = tf.reduce_mean(reconstr_loss+latent_loss)


#定义优化器
optimizer = tf.train.AdamOptimizer(learning_rate).minimize(cost)

num_batch = int(np.ceil(mnist.train.num_examples / batch_size))
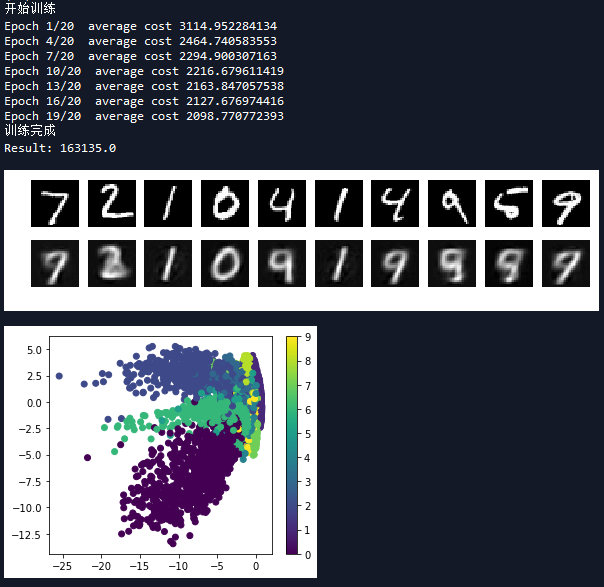
5.开始训练,并可视化输出
'''
开始训练
'''
with tf.Session() as sess:
    sess.run(tf.global_variables_initializer())

    print('开始训练')
    for epoch in range(training_epochs):
        total_cost = 0.0
        for i in range(num_batch):
            batch_x,batch_y = mnist.train.next_batch(batch_size)
            _,loss = sess.run([optimizer,cost],feed_dict={x:batch_x})
            total_cost += loss

        #打印信息
        if epoch % display_epoch == 0:
            print('Epoch {}/{}  average cost {:.9f}'.format(epoch+1,training_epochs,total_cost/num_batch))

    print('训练完成')

    #测试
    print('Result:',cost.eval({x:mnist.test.images}))
    #数据可视化
    reconstruction = sess.run(reconstruction,feed_dict = {x:mnist.test.images[:show_num]})
    plt.figure(figsize=(1.0*show_num,1*2))
    for i in range(show_num):
        #原始图像
        plt.subplot(2,show_num,i+1)
        plt.imshow(np.reshape(mnist.test.images[i],(28,28)),cmap='gray')
        plt.axis('off')

        #变分自编码器重构图像
        plt.subplot(2,show_num,i+show_num+1)
        plt.imshow(np.reshape(reconstruction[i],(28,28)),cmap='gray')
        plt.axis('off')
    plt.show()

    #绘制均值和方差代表的二维数据
    plt.figure(figsize=(5,4))
    #将onehot转为一维编码
    labels = [np.argmax(y) for y in mnist.test.labels]
    mean,log_sigma = sess.run([z_mean,z_log_sigma_sq],feed_dict={x:mnist.test.images})
    plt.scatter(mean[:,0],mean[:,1],c=labels)
    plt.colorbar()
    plt.show()
    '''
    plt.figure(figsize=(5,4))
    plt.scatter(log_sigma[:,0],log_sigma[:,1],c=labels)
    plt.colorbar()
    plt.show()
    '''

    '''
    高斯分布取样,生成模拟数据
    '''
    n = 15   #15 x 15的figure
    digit_size = 28
    figure = np.zeros((digit_size * n, digit_size * n))
    grid_x = norm.ppf(np.linspace(0.05, 0.95, n))
    grid_y = norm.ppf(np.linspace(0.05, 0.95, n))
    for i, yi in enumerate(grid_x):
        for j, xi in enumerate(grid_y):
            z_sample = np.array([[xi, yi]])
            x_decoded = sess.run(reconstructionout,feed_dict={zinput:z_sample})

            digit = x_decoded[0].reshape(digit_size, digit_size)
            figure[i * digit_size: (i + 1) * digit_size,
                   j * digit_size: (j + 1) * digit_size] = digit

    plt.figure(figsize=(10, 10))
    plt.imshow(figure, cmap='gray')
    plt.show()
为了进一步验证模型学习到了数据分布的情况,这次在高斯分布抽样中四级去一些点,将其映射到模型中的z,然后通过解码部分还原成真实图片,效果如下:
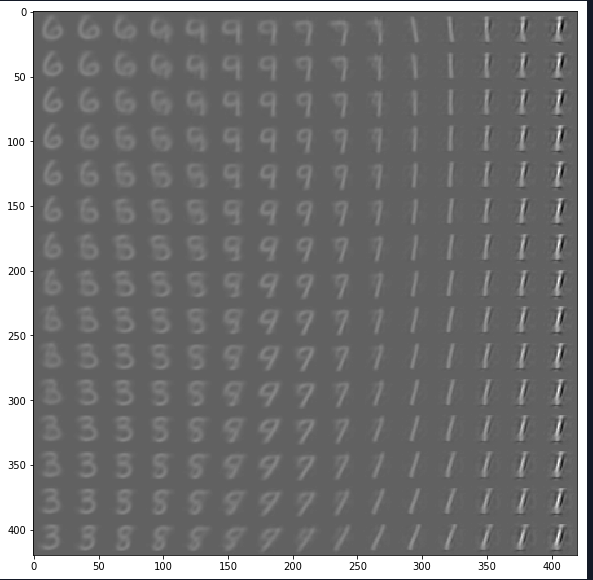
注意:代码中的norm.ppf()函数的作用是从按照百分比由大到小排列后的标准高斯分布中取值。norm代表标准高斯分布,ppf代表累积分布函数的反函数。例如x=ppf(0.05),就表示在集合中小于x的数所占的概率等于0.05。因此我们可以利用标准高斯分布的分布函数,计算出x的值。
完整代码:

# -*- coding: utf-8 -*-
"""
Created on Thu May 31 15:34:08 2018

@author: zy
"""

'''
变分自编码
'''


import tensorflow as tf
import numpy as np
import matplotlib.pyplot as plt
from tensorflow.examples.tutorials.mnist import input_data
from scipy.stats import norm


mnist = input_data.read_data_sets('MNIST-data',one_hot=True)

print(type(mnist)) #<class 'tensorflow.contrib.learn.python.learn.datasets.base.Datasets'>

print('Training data shape:',mnist.train.images.shape)           #Training data shape: (55000, 784)
print('Test data shape:',mnist.test.images.shape)                #Test data shape: (10000, 784)
print('Validation data shape:',mnist.validation.images.shape)    #Validation data shape: (5000, 784)
print('Training label shape:',mnist.train.labels.shape)          #Training label shape: (55000, 10)

train_X = mnist.train.images
train_Y = mnist.train.labels
test_X = mnist.test.images
test_Y = mnist.test.labels


'''
定义网络参数
'''
n_input = 784
n_hidden_1 = 256
n_hidden_2 = 2
learning_rate = 0.001
training_epochs = 20               #迭代轮数
batch_size = 128                   #小批量数量大小
display_epoch = 3
show_num = 10

x = tf.placeholder(dtype=tf.float32,shape=[None,n_input])
#后面通过它输入分布数据,用来生成模拟样本数据
zinput = tf.placeholder(dtype=tf.float32,shape=[None,n_hidden_2])

'''
定义学习参数
'''
weights = {
        'w1':tf.Variable(tf.truncated_normal([n_input,n_hidden_1],stddev = 0.001)),
        'mean_w1':tf.Variable(tf.truncated_normal([n_hidden_1,n_hidden_2],stddev = 0.001)),
        'log_sigma_w1':tf.Variable(tf.truncated_normal([n_hidden_1,n_hidden_2],stddev = 0.001)),
        'w2':tf.Variable(tf.truncated_normal([n_hidden_2,n_hidden_1],stddev = 0.001)),
        'w3':tf.Variable(tf.truncated_normal([n_hidden_1,n_input],stddev = 0.001))
        }

biases = {
        'b1':tf.Variable(tf.zeros([n_hidden_1])),
        'mean_b1':tf.Variable(tf.zeros([n_hidden_2])),
        'log_sigma_b1':tf.Variable(tf.zeros([n_hidden_2])),
        'b2':tf.Variable(tf.zeros([n_hidden_1])),
        'b3':tf.Variable(tf.zeros([n_input]))
        }


'''
定义网络结构
'''
#第一个全连接层是由784个维度的输入样->256个维度的输出
h1 = tf.nn.relu(tf.add(tf.matmul(x,weights['w1']),biases['b1']))
#第二个全连接层并列了两个输出网络
z_mean = tf.add(tf.matmul(h1,weights['mean_w1']),biases['mean_b1'])
z_log_sigma_sq = tf.add(tf.matmul(h1,weights['log_sigma_w1']),biases['log_sigma_b1'])


#然后将两个输出通过一个公式的计算,输入到以一个2节点为开始的解码部分 高斯分布样本
eps = tf.random_normal(tf.stack([tf.shape(h1)[0],n_hidden_2]),0,1,dtype=tf.float32)
z = tf.add(z_mean,tf.multiply(tf.sqrt(tf.exp(z_log_sigma_sq)),eps))


#解码器 由2个维度的输入->256个维度的输出
h2 = tf.nn.relu(tf.matmul(z,weights['w2']) + biases['b2'])
#解码器 由256个维度的输入->784个维度的输出  即还原成原始输入数据
reconstruction = tf.matmul(h2,weights['w3']) + biases['b3']


#这两个节点不属于训练中的结构,是为了生成指定数据时用的
h2out = tf.nn.relu(tf.matmul(zinput,weights['w2']) + biases['b2'])
reconstructionout = tf.matmul(h2out,weights['w3']) + biases['b3']

'''
构建模型的反向传播
'''
#计算重建loss
#计算原始数据和重构数据之间的损失,这里除了使用平方差代价函数,也可以使用交叉熵代价函数
reconstr_loss = 0.5*tf.reduce_sum((reconstruction-x)**2)
print(reconstr_loss.shape)    #(,) 标量
#使用KL离散度的公式
latent_loss = -0.5*tf.reduce_sum(1 + z_log_sigma_sq - tf.square(z_mean) - tf.exp(z_log_sigma_sq),1)
print(latent_loss.shape)      #(128,)
cost = tf.reduce_mean(reconstr_loss+latent_loss)


#定义优化器
optimizer = tf.train.AdamOptimizer(learning_rate).minimize(cost)

num_batch = int(np.ceil(mnist.train.num_examples / batch_size))

'''
开始训练
'''
with tf.Session() as sess:
    sess.run(tf.global_variables_initializer())

    print('开始训练')
    for epoch in range(training_epochs):
        total_cost = 0.0
        for i in range(num_batch):
            batch_x,batch_y = mnist.train.next_batch(batch_size)
            _,loss = sess.run([optimizer,cost],feed_dict={x:batch_x})
            total_cost += loss

        #打印信息
        if epoch % display_epoch == 0:
            print('Epoch {}/{}  average cost {:.9f}'.format(epoch+1,training_epochs,total_cost/num_batch))

    print('训练完成')

    #测试
    print('Result:',cost.eval({x:mnist.test.images}))
    #数据可视化
    reconstruction = sess.run(reconstruction,feed_dict = {x:mnist.test.images[:show_num]})
    plt.figure(figsize=(1.0*show_num,1*2))
    for i in range(show_num):
        #原始图像
        plt.subplot(2,show_num,i+1)
        plt.imshow(np.reshape(mnist.test.images[i],(28,28)),cmap='gray')
        plt.axis('off')

        #变分自编码器重构图像
        plt.subplot(2,show_num,i+show_num+1)
        plt.imshow(np.reshape(reconstruction[i],(28,28)),cmap='gray')
        plt.axis('off')
    plt.show()

    #绘制均值和方差代表的二维数据
    plt.figure(figsize=(5,4))
    #将onehot转为一维编码
    labels = [np.argmax(y) for y in mnist.test.labels]
    mean,log_sigma = sess.run([z_mean,z_log_sigma_sq],feed_dict={x:mnist.test.images})
    plt.scatter(mean[:,0],mean[:,1],c=labels)
    plt.colorbar()
    plt.show()
    '''
    plt.figure(figsize=(5,4))
    plt.scatter(log_sigma[:,0],log_sigma[:,1],c=labels)
    plt.colorbar()
    plt.show()
    '''

    '''
    高斯分布取样,生成模拟数据
    '''
    n = 15   #15 x 15的figure
    digit_size = 28
    figure = np.zeros((digit_size * n, digit_size * n))
    grid_x = norm.ppf(np.linspace(0.05, 0.95, n))
    grid_y = norm.ppf(np.linspace(0.05, 0.95, n))
    for i, yi in enumerate(grid_x):
        for j, xi in enumerate(grid_y):
            z_sample = np.array([[xi, yi]])
            x_decoded = sess.run(reconstructionout,feed_dict={zinput:z_sample})

            digit = x_decoded[0].reshape(digit_size, digit_size)
            figure[i * digit_size: (i + 1) * digit_size,
                   j * digit_size: (j + 1) * digit_size] = digit

    plt.figure(figsize=(10, 10))
    plt.imshow(figure, cmap='gray')
    plt.show()
参考文章
[1]变分自编码器(一):原来是这么一回事(推荐)
