注:远程监控服务器指标,可查看、CPU、内存、网络信息等,搭建依赖Docker环境,可参考:yum安装Docker环境
服务端:Grafana(可视化展示) + Prometheus(数据源,配置客户端信息)
CentOS客户端导出机器指标:node_exporter
Windows客户端导出机器指标:wmi_exporter
使用grafana-dashboards说明
CentOS仪表盘:https://grafana.com/grafana/dashboards/8919
Windows仪表盘:https://grafana.com/grafana/dashboards/2129
下载相关镜像
$ docker pull prom/prometheus
$ docker pull prom/node-exporter
$ docker pull grafana/grafana
创建相关配置
配置数据源文件(样例仅监控本机,如需监控其他机器修改-targets即可,如: ['localhost:9100','192.168.1.100:9100','192.168.1.200:9182'])
$ vim /home/prometheus.yml
global:
scrape_interval: 15s # By default, scrape targets every 15 seconds.# Attach these labels to any time series or alerts when communicating with
# external systems (federation, remote storage, Alertmanager).
external_labels:
monitor: 'server-monitor'# A scrape configuration containing exactly one endpoint to scrape:
# Here it's Prometheus itself.
scrape_configs:
# The job name is added as a label `job=<job_name>` to any timeseries scraped from this config.
- job_name: 'prometheus'# Override the global default and scrape targets from this job every 5 seconds.
scrape_interval: 5sstatic_configs:
- targets: ['localhost:9090']
labels:
instance: prometheus
- targets: ['localhost:9100']
labels:
#nodename: test
instance: local
运行镜像
1.客户端导出机器指标(本实例监控本机)
$ docker run --restart=unless-stopped -d --name=node-exporter -p 9100:9100 -v /etc/localtime:/etc/localtime prom/node-exporter
2.可视化展示grafana服务
$ docker run --restart=unless-stopped -d --name=grafana -p 3000:3000 grafana/grafana
3.数据源prometheus服务
$ docker run --restart=unless-stopped -d --name=prometheus -p 9090:9090 -v /home/prometheus.yml:/etc/prometheus/prometheus.yml prom/prometheus
配置grafana服务
1.访问:http://ip:3000 默认用户名/密码:admin/admin

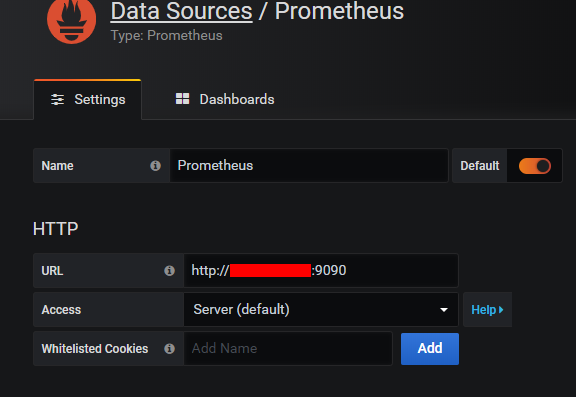
2.配置数据源-prometheus,填写http地址后保存(Save & Test)

3.导入仪表盘

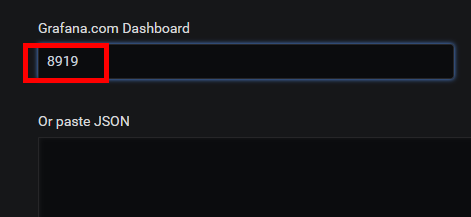
4.填写仪表盘id(Centos:8919,Windows:2129)
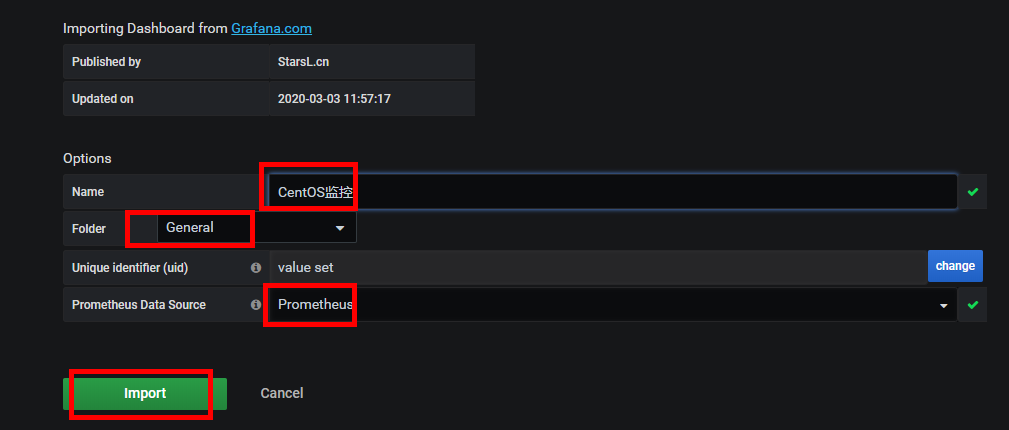
5.仪表盘预览,点击保存即可

CentOS监控最终展示效果

Windows监控最终展示效果
