You work with sensitive data in Elasticsearch indices that you do not want everyone to see in their Kibana dashboards. Like a hospital with patient names. You could give each department their own Elasticsearch cluster in order to prevent all departments to see the patient's names, for example.
But wouldn't it be great if there was only one Elasticsearch cluster and every departments could manage their own Kibana dashboards? And still have the security in place to prevent leaking of private data?
With Elasticsearch Shield, you can create a configurable layer of security on top of your Elasticsearch cluster. In this article, we will explore a small example setup with Shield and Kibana.
In this article, we'll use Elasticsearch 1.4.4, Shield 1.0.1 and Kibana 4.0.0. These are at the time of writing the most-recent versions. Beginner knowledge of Elasticsearch is expected.
Suppose we want to keep our patient's names private. An index of patients will be available only for one department. An index of cases will be available to all departments.
First, we'll add some test data to the cluster. Create a file hostipal.json with the following content:
{ "index" : { "_index" : "cases", "_type" : "case", "_id" : "101" } }
{ "admission" : "2015-01-03", "discharge" : "2015-01-04", "injury" : "broken arm" }
{ "index" : { "_index" : "cases", "_type" : "case", "_id" : "102" } }
{ "admission" : "2015-01-03", "discharge" : "2015-01-06", "injury" : "broken leg" }
{ "index" : { "_index" : "cases", "_type" : "case", "_id" : "103" } }
{ "admission" : "2015-01-06", "discharge" : "2015-01-07", "injury" : "broken nose" }
{ "index" : { "_index" : "cases", "_type" : "case", "_id" : "104" } }
{ "admission" : "2015-01-07", "discharge" : "2015-01-07", "injury" : "bruised arm" }
{ "index" : { "_index" : "cases", "_type" : "case", "_id" : "105" } }
{ "admission" : "2015-01-08", "discharge" : "2015-01-10", "injury" : "broken arm" }
{ "index" : { "_index" : "patients", "_type" : "patient", "_id" : "101" } }
{ "name" : "Adam", "age" : 28 }
{ "index" : { "_index" : "patients", "_type" : "patient", "_id" : "102" } }
{ "name" : "Bob", "age" : 45 }
{ "index" : { "_index" : "patients", "_type" : "patient", "_id" : "103" } }
{ "name" : "Carol", "age" : 34 }
{ "index" : { "_index" : "patients", "_type" : "patient", "_id" : "104" } }
{ "name" : "David", "age" : 14 }
{ "index" : { "_index" : "patients", "_type" : "patient", "_id" : "105" } }
{ "name" : "Eddie", "age" : 72 }
Then bulk index these documents in the cluster:
$ curl -X POST 'http://localhost:9200/_bulk' --data-binary @./hospital.json
Without security, every user can access all documents. Let's install Shield to add security.
Directions on how to install Shield can be found at the Elasticsearch website . We will do this step by step.
Shield is a commercial product, so first we need to install the license manager:
$ elasticsearch/bin/plugin -i elasticsearch/license/latest
-> Installing elasticsearch/license/latest...
Trying http://download.elasticsearch.org/elasticsearch/license/license-latest.zip...
Downloading .....................................DONE
Installed elasticsearch/license/latest into /home/patrick/blog/elasticsearch/plugins/license
Now install Shield itself in the same manner:
$ elasticsearch/bin/plugin -i elasticsearch/shield/latest
-> Installing elasticsearch/shield/latest...
Trying http://download.elasticsearch.org/elasticsearch/shield/shield-latest.zip...
Downloading .....................................DONE
Installed elasticsearch/shield/latest into /home/patrick/blog/elasticsearch/plugins/shield
You will need to restart the nodes of your cluster to activate the plugins.
In the logs of Elasticsearch you'll see some messages from the new plugins:
[2015-02-12 08:18:01,347][INFO ][shield.license ] [node0] enabling license for [shield]
[2015-02-12 08:18:01,347][INFO ][license.plugin.core ] [node0] license for [shield] - valid
[2015-02-12 08:18:01,355][ERROR][shield.license ] [node0]
#
# Shield license will expire on [Saturday, March 14, 2015]. Cluster health, cluster stats and indices stats operations are
# blocked on Shield license expiration. All data operations (read and write) continue to work. If you
# have a new license, please update it. Otherwise, please reach out to your support contact.
#
Notice that you will get a 30-day trial period to experiment with Shield.Now all our data is protected. See what happens when we try to get a document:
$ curl localhost:9200/cases/case/101?pretty=true
{
    "error" : "AuthenticationException[missing authentication token for REST request [/cases/case/1]]",
    "status" : 401
}
We need to add some roles and users to configure the role-based access control of Shield. First we define the roles and their privileges. The definition of these are found in the elasticsearch/config/shield/roles.yml file. Some roles, like admin and user are predefined:
# All cluster rights
# All operations on all indices
admin:
  cluster: all
  indices:
    '*': all

# Read-only operations on indices
user:
  indices:
    '*': read
Let's edit this roles.yml file to describe our needs. We do not want for every user to access all indices, so we'll change user.indices . We'll add the two roles needed for our organization: doctor and nurse. A doctor has more privileges than a nurse. Doctors can access all indices. Nurses can only access the cases index:
# Read-only operations on indices
#user:
#  indices:
#    '*': read

# Doctors can access all indices
doctor:
  indices:
    '*': read

# Nurses can only access the cases index
nurse:
  indices:
    'cases': read
Now that the roles are defined, we can create users that have these roles. Shield provides three realms to store the users: an internal realm, LDAP or Active Directory. For now, we use the internal realm. The realm is configured inelasticsearch/config/elasticsearch.yml . If nothing is explicitly configured, the internal realm is used.
To add users the esusers command line tool can be used. Let's create two users (both with abc123 as password), one for each role:
$ elasticsearch/bin/shield/esusers useradd alice -r nurse
$ elasticsearch/bin/shield/esusers useradd bob -r doctor
Just to check if the security works:
$ curl --user alice:abc123 localhost:9200/_count?pretty=true
{
  "count" : 5,
  "_shards" : {
    "total" : 1,
    "successful" : 1,
    "failed" : 0
  }
}
$ curl --user bob:abc123 localhost:9200/_count?pretty=true
{
  "count" : 10,
  "_shards" : {
    "total" : 2,
    "successful" : 2,
    "failed" : 0
  }
}
Alice can see the 5 cases in our cases index. Bob can see those 5 cases plus the 5 patients in the patients index.
Now it's time to add Kibana in the mix. Instructions to download and install Kibana 4 can be found on the Elasticsearch website .
When we start the Kibana server we notice that Kibana is not allowed access to the Elasticsearch cluster:
$ kibana/bin/kibana
{"@timestamp":"2015-02-26T08:24:48.958Z","level":"fatal","message":"AuthenticationException[missing authentication token for REST request [/.kibana/config/_search]]","node_env":"production","error":{"message":"AuthenticationException[missing authentication token for REST request [/.kibana/config/_search]]","name":"Error","stack":"Error: AuthenticationException[missing authentication token for REST request [/.kibana/config/_search]]
 at respond (/home/patrick/kibana/src/node_modules/elasticsearch/src/lib/transport.js:235:15)
 at checkRespForFailure (/home/patrick/kibana/src/node_modules/elasticsearch/src/lib/transport.js:203:7)
 at HttpConnector. (/home/patrick/kibana/src/node_modules/elasticsearch/src/lib/connectors/http.js:156:7)
 at IncomingMessage.bound (/home/patrick/kibana/src/node_modules/elasticsearch/node_modules/lodash-node/modern/internals/baseBind.js:56:17)
 at IncomingMessage.emit (events.js:117:20)
 at _stream_readable.js:944:16
 at process._tickCallback (node.js:442:13)
"}}
We need to tell Shield that Kibana is allowed to access our cluster. Extra information of how to let Kibana work with Shield can be found in the Elasticsearch guide .
Shield is shipped with a default configuration for Kibana 4. We find the following role definition in elasticsearch/config/shield/roles.yml .
# The required role for kibana 4 users
kibana4:
  cluster: cluster:monitor/nodes/info
  indices:
    '*':
      - indices:admin/mappings/fields/get
      - indices:admin/validate/query
      - indices:data/read/search
      - indices:data/read/msearch
      - indices:admin/get
    '.kibana':
      - indices:admin/exists
      - indices:admin/mapping/put
      - indices:admin/mappings/fields/get
      - indices:admin/refresh
      - indices:admin/validate/query
      - indices:data/read/get
      - indices:data/read/mget
      - indices:data/read/search
      - indices:data/write/delete
      - indices:data/write/index
      - indices:data/write/update
When the Kibana Server starts it needs to access the .kibana index. So we need to create a user in Shield for Kibana to connect with:
$ elasticsearch/bin/shield/esusers useradd kibana -r kibana4
This account must be configured in Kibana. Modify kibana/conf/kibana.yml :
# If your Elasticsearch is protected with basic auth, this is the user credentials
# used by the Kibana server to perform maintence on the kibana_index at statup. Your Kibana
# users will still need to authenticate with Elasticsearch (which is proxied thorugh
# the Kibana server)
kibana_elasticsearch_username: kibana
kibana_elasticsearch_password: abc123
The Kibana users must have the kibana4 role to be able to work with Kibana. They must be able to store their visualizations and dashboards in the .kibana index:
$ elasticsearch/bin/shield/esusers roles alice -a kibana4
$ elasticsearch/bin/shield/esusers roles bob -a kibana4
Since the default kibana4 role has read access on all indices, alice and bob will be granted all access on all indices. Therefore the role permissions must be modified:
# Doctors can access all indices
doctor:
  indices:
    'cases,patients':
      - indices:admin/mappings/fields/get
      - indices:admin/validate/query
      - indices:data/read/search
      - indices:data/read/msearch
      - indices:admin/get

# Nurses can only access the cases index
nurse:
  indices:
    'cases':
      - indices:admin/mappings/fields/get
      - indices:admin/validate/query
      - indices:data/read/search
      - indices:data/read/msearch
      - indices:admin/get

# The required role for kibana 4 users
kibana4:
  cluster:
      - cluster:monitor/nodes/info
      - cluster:monitor/health
  indices:
    '.kibana':
      - indices:admin/exists
      - indices:admin/mapping/put
      - indices:admin/mappings/fields/get
      - indices:admin/refresh
      - indices:admin/validate/query
      - indices:data/read/get
      - indices:data/read/mget
      - indices:data/read/search
      - indices:data/write/delete
      - indices:data/write/index
      - indices:data/write/update
      - indices:admin/create
With this configuration any user with the kibana4 role is able to use Kibana but only sees data that he or she has the proper clearance for.
We can now start the Kibana Server and see that it runs as it should:
$ kibana/bin/kibana
{"@timestamp":"2015-02-26T08:53:18.961Z","level":"info","message":"Listening on 0.0.0.0:5601","node_env":"production"}
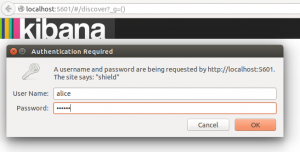
We can open a browser and head to localhost:5601 to open the Kibana web interface. Log in as Alice:
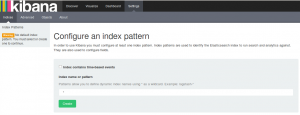
After logging in, Kibana will ask for the index pattern. We'll keep it simple:
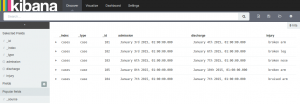
Then in the discover tab you can add fields to your view. Notice that Alice only sees cases:
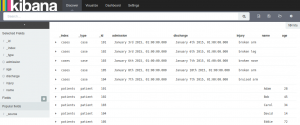
When we log in as Bob our discover tab shows both cases and patients:
To summarize: we added security to Elasticsearch with Shield and configured some users and roles. There's nothing more to it!