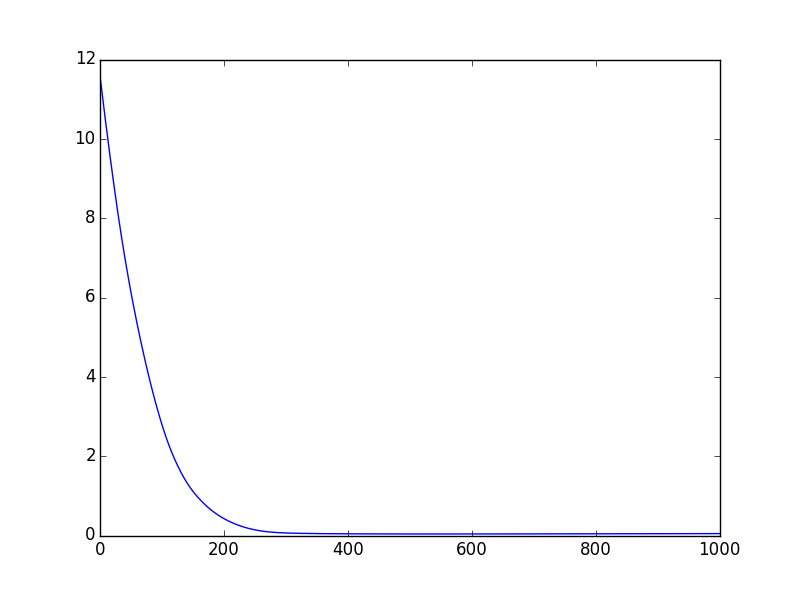
 1 # -*- coding: utf-8 -*-
 2 """
 3 Created on Wed Apr 22 17:39:19 2015
 4
 5 @author: 90Zeng
 6 """
 7
 8 import numpy
 9 import theano
10 import theano.tensor as T
11 import matplotlib.pyplot as plt
12 rng = numpy.random
13 N = 400 # 400个样本
14 feats = 784 # 每个样本的维度
15 D = (rng.randn(N, feats), rng.randint(size=N, low=0, high=2))
16 training_steps = 10000
17
18 # Declare Theano symbolic variables
19 x = T.dmatrix("x")
20 y = T.dvector("y")
21
22 # 随机初始化权重
23 w = theano.shared(rng.randn(feats), name="w")
24 # 偏置初始化为 0
25 b = theano.shared(0.0, name="b")
26 print "Initial model:"
27 print w.get_value(), b.get_value()
28
29 # Construct Theano expression graph
30 p_1 = 1 / (1 + T.exp(-T.dot(x, w) - b))   # Probability that target = 1
31 prediction = p_1 > 0.5                    # The prediction thresholded
32 xent = -y * T.log(p_1) - (1-y) * T.log(1-p_1) # Cross-entropy loss function
33 lost_avg = xent.mean()
34 cost = xent.mean() + 0.01 * (w ** 2).sum()# The cost to minimize
35 gw, gb = T.grad(cost, [w, b])             # Compute the gradient of the cost
36                                           # (we shall return to this in a
37                                           # following section of this tutorial)
38
39 # Compile
40 train = theano.function(
41     inputs=[x,y],
42     outputs=[prediction, lost_avg],
43     updates=((w, w - 0.1 * gw),(b, b - 0.1 * gb)),
44     )
45 predict=theano.function(
46     inputs=[x],
47     outputs=prediction,
48     )
49
50 # Train
51 err = []
52 for i in range(training_steps):
53     pred, er = train(D[0], D[1])
54     err.append(er)
55
56 print "Final model:"
57 print w.get_value(), b.get_value()
58 print "target values for D:", D[1]
59 print "prediction on D:", predict(D[0])
60
61 # 画出损失函数图
62 x = range(1000)
63 plt.plot(x,err[0:1000])
损失函数随着迭代次数变化,运行结果: