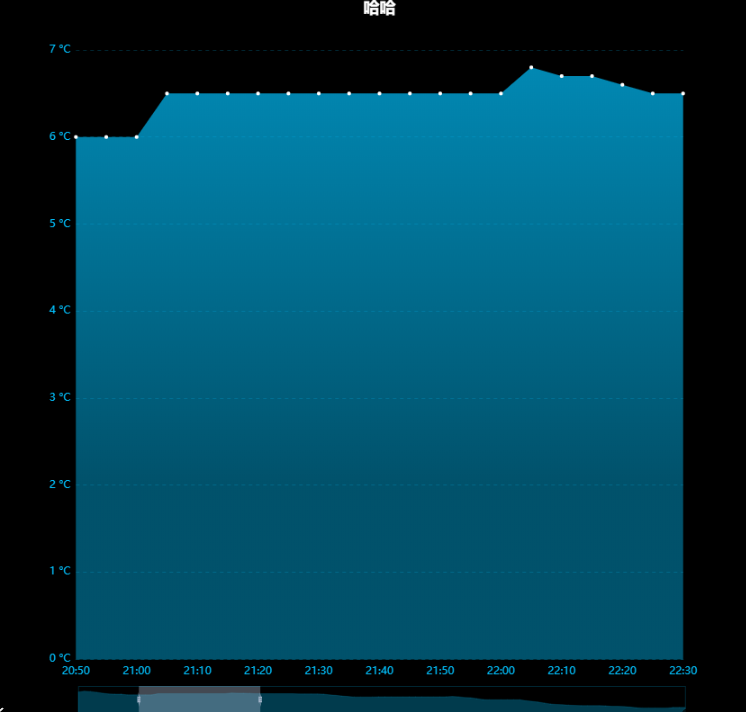
测试地址   https://gallery.echartsjs.com/editor.html?c=x6p5SsIEzt


var listN = '高温';
var unit = '°C'; //单位
var timeArray = ["20:00", "20:05", "20:10", "20:15", "20:20", "20:25", "20:30", "20:35", "20:40", "20:45", "20:50", "20:55", "21:00", "21:05", "21:10", "21:15", "21:20", "21:25", "21:30", "21:35", "21:40", "21:45", "21:50", "21:55", "22:00", "22:05", "22:10", "22:15", "22:20", "22:25", "22:30", "22:35", "22:40", "22:45", "22:50", "22:55", "23:00", "23:05", "23:10", "23:15", "23:20", "23:25", "23:30", "23:35", "23:40", "23:45", "23:50", "23:55", "00:00", "00:05", "00:10", "00:15", "00:20", "00:25", "00:30", "00:35", "00:40", "00:45", "00:50", "00:55", "01:00", "01:05", "01:10", "01:15", "01:20", "01:25", "01:30", "01:35", "01:40", "01:45", "01:50", "01:55", "02:00", "02:05", "02:10", "02:15", "02:20", "02:25", "02:30", "02:35", "02:40", "02:45", "02:50", "02:55", "03:00", "03:05", "03:10", "03:15", "03:20", "03:25", "03:30", "03:35", "03:40", "03:45", "03:50", "03:55", "04:00", "04:05", "04:10", "04:15"]; //时间
var dataArray = ["7.2", "7.6", "7.4", "7.1", "6.7", "6.4", "6.3", "6.3", "6.0", "6.0", "6.0", "6.0", "6.0", "6.5", "6.5", "6.5", "6.5", "6.5", "6.5", "6.5", "6.5", "6.5", "6.5", "6.5", "6.5", "6.8", "6.7", "6.7", "6.6", "6.5", "6.5", "6.5", "6.5", "6.5", "6.5", "6.5", "6.4", "6.4", "6.4", "6.4", "6.3", "6.0", "5.8", "5.5", "5.3", "5.1", "5.1", "5.1", "5.1", "5.2", "5.2", "5.2", "5.2", "5.2", "5.2", "5.2", "5.2", "5.2", "5.2", "5.2", "5.2", "5.3", "5.2", "4.9", "4.8", "4.4", "4.0", "3.9", "3.9", "3.9", "3.9", "3.9", "3.9", "3.5", "3.2", "2.9", "2.5", "2.1", "1.9", "1.8", "1.6", "1.5", "1.4", "1.4", "1.4", "1.4", "1.3", "1.1", "1.1", "1.0", "0.8", "0.5", "0.4", "0.4", "0.4", "0.4", "0.4", "0.6", "0.6", "0.6"]; //data

option = {
     backgroundColor: '#000',//背景颜色

     title: {
          left: 'center',
          text: '工作机器人数',
          textStyle: {
              color: '#fff' //标题颜色
          }
     },

    tooltip: {
        trigger: 'axis',
        formatter: ('{b}<br />{a}:{c}'+unit),
    },

    dataZoom: {
        bottom: '0',
         start: 10, //数据窗口范围的起始百分比
         end: 30,  //数据窗口范围的结束百分比
           handleSize: "50%",
        dataBackground: {
            lineStyle: {
                color: '#02C2FF'
            },
            areaStyle: {
                color: 'rgba(2,194,255,1)'
            }
        },
        borderColor: 'rgba(2,194,255,0.2)',
        textStyle: {
            color: '#02C2FF',
        }
    },


    xAxis: [{
        type: 'category',
        boundaryGap: false,

        axisLine: {
            show: true,
            lineStyle: {
                 color: 'rgba(2,194,255,0.2)' //横坐标那一条线的颜色
            },
         },

         axisLabel: {
            textStyle: {
                 color: '#02C2FF', //横坐标  字段名的颜色
                // color:"red",
                fontSize: 12,
                margin:15,
            },
        },
        axisTick: { show: false,},
        data: timeArray
    }],


    yAxis: [{
        type: 'value',

        splitLine: {
            show: true,
            lineStyle: {
                 color: 'rgba(2,194,255,0.2)', //横坐标  分割线颜色

            }
        },

        axisLine: {show: false,},
        axisLabel: {
             margin:6,
            textStyle: {
                color: '#02C2FF'
            },
            formatter: ('{value} '+unit)
        },
        axisTick: { show: false,},
        data:['0','4','8','12','16','20']
    }],

    series: [{
        name: listN,
        type: 'line',
           symbol:'circle',
        symbolSize:4,
        lineStyle: {
            normal: {
                opacity:0
            }
        },

        itemStyle:{
            color:'#FFFFFF'
        },

        areaStyle: { //区域填充样式
            normal: {
                color: new echarts.graphic.LinearGradient(0, 0, 0, 1, [
                   { offset: 0,  color: 'rgba(2,194,255,1)'}, //上边区域
                   { offset: 0.7,  color: 'rgba(2,194,255,0.6)'} //下边的区域
                ], false)
            }
        },

        data: dataArray
    }]
};