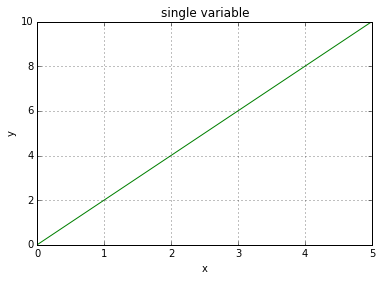
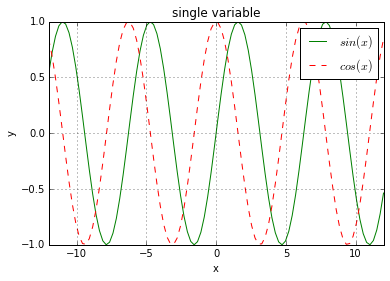
import sys
reload(sys)
sys.setdefaultencoding('utf-8')

import matplotlib.pyplot as plt
import numpy as np

plt.figure(1)#实例化作图变量
plt.title("single variable")#图像标题
plt.xlabel('x')
plt.ylabel('y')
plt.axis([0, 5,0, 10])#x轴范围是0-5,y轴范围是0-10
plt.grid(True)# 是否网格化
xx = np.linspace(0, 5, 10)#在0-5之间产生10个数据
plt.plot(xx, 2 * xx, 'g-')
plt.show()

plt.figure(2)#实例化作图变量
plt.title("single variable")#图像标题
plt.xlabel('x')
plt.ylabel('y')
plt.axis([-12, 12,-1, 1])#x轴范围是-12-12,y轴范围是-1-1
plt.grid(True)# 是否网格化
xx = np.linspace(-12, 12, 100)#在-12-12之间产生100个数据
plt.plot(xx, np.sin(xx), 'g-', label="$sin(x)$")
plt.plot(xx, np.cos(xx), 'r--', label="$cos(x)$")
plt.legend()
plt.show()
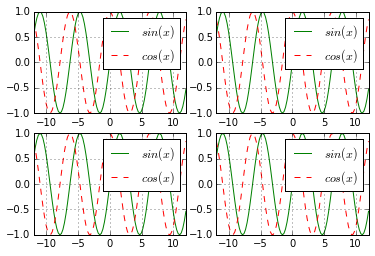
#绘制多轴图
def draw(plt):
    plt.axis([-12, 12,-1, 1])#x轴范围是-12-12,y轴范围是-1-1
    plt.grid(True)# 是否网格化
    xx = np.linspace(-12, 12, 100)#在-12-12之间产生100个数据
    plt.plot(xx, np.sin(xx), 'g-', label="$sin(x)$")
    plt.plot(xx, np.cos(xx), 'r--', label="$cos(x)$")
    plt.legend()

plt.figure(3)
plt1 = plt.subplot(2,2,1)#两行两列中第一个
draw(plt1)
plt2 = plt.subplot(2,2,2)#两行两列中第2个
draw(plt2)
plt3 = plt.subplot(2,2,3)#两行两列中第3个
draw(plt3)
plt4 = plt.subplot(2,2,4)#两行两列中第4个
draw(plt4)

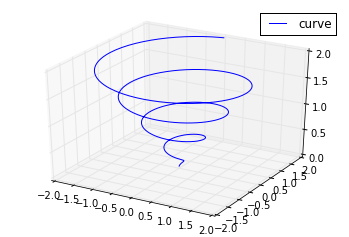
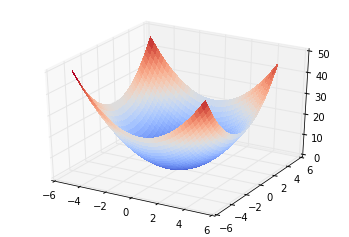
from mpl_toolkits.mplot3d import Axes3D

fig = plt.figure()
ax = fig.add_subplot(1,1,1, projection='3d')
theta = np.linspace(-4 * np.pi, 4 * np.pi, 500)
z = np.linspace(0,2,500)
r =z
x = r * np.sin(theta)
y = r * np.cos(theta)
ax.plot(x, y, z, label='curve')
ax.legend()
plt.show()
fig = plt.figure()
ax = fig.add_subplot(1,1,1, projection='3d')
xx = np.linspace(0, 5, 10)
yy = np.linspace(0, 5, 10)
zz1 = xx
zz2 = 2 * xx;
zz3 = 3 * xx
ax.scatter(xx, yy, zz1, c = 'red', marker='o')
ax.scatter(xx, yy, zz2, c = 'green', marker='^')
ax.scatter(xx, yy, zz3, c = 'black', marker='*')
ax.legend()
plt.show()

from matplotlib import cm
fig = plt.figure()
ax = fig.gca( projection='3d')
X = np.arange(-5,5,0.25)
Y = np.arange(-5,5,0.25)
X, Y = np.meshgrid(X, Y)
Z = X ** 2 + Y ** 2
ax.plot_surface(X, Y, Z, rstride=1,cstride =1, cmap =cm.coolwarm,
               linewidth = 0,antialiased = False)
plt.show()