环境
python相关环境
- python 3.7
- graphviz
- sklearn
- pandas
- numpy
数据
- nsrxx
例:
(65353,8919,173,2016-04-15 00:00:00.0,2017-06-29 15:18:07.0,0)
- zzsfp
- zzsfp_humx
1.数据处理
将数据zzsfp和zzsfp_humx两个数据合并为com
com = pd.merge(zzsfp, nsrxxtemp1, how="inner", on="那一列")
删除部分列减少特征
com = df.drop(labels={'要删除的列'}, axis=1)
# com只保留了
['数量', '单价', '金额', '税额', '销方代码', '购方代码', '价税合计']
将内容类型转换为int64
com['数量'] = pd.to_numeric(com['要转换的列'], errors='coerce').fillna('如果某一格转换失败用什么填充').astype('要转换成什么类型')
删除中文字符、英文字符以及部分符号
# 通过正则表达式

# 所有中文
com = com.replace('^[u4e00-u9fa5]{0,}$', 0, regex=True)
# 所有英文
com = com.replace('^[A-Za-z]+$', 0, regex=True)
2.生成数据集
取com中的一万条数据作为训练集 hwmx
找出其中有问题的企业并设置与hwmx想对应的目标集
这里我是通过pandas随机取出10000行保存到数据库通过sql语句进行筛选的,sql语句没有保留
查找到的有问题的企业
[50743, 142165, 71981, 283865, 109943, 114237, 212158, 216833, 159859, 212638, 52124, 6965]
生成目标集
result = []


def getResult(x):
    if x in [50743, 142165, 71981, 283865, 109943, 114237, 212158, 216833, 159859, 212638, 52124, 6965]:
        result.append(1)
    else:
        result.append(0)


hwmx['销方代码'].apply(getResult)
3.生成模型
# 转为数组
com_numpy = com.drop(labels={'id'}, axis=1)
com_numpy = com_numpy.to_numpy()
arr = hwmx.to_numpy()
res = np.array(result)

# 将训练集划分成训练集和验证集
Xtrain, Xtest, Ytrain, Ytest = train_test_split(arr, res, test_size=0.3)  # 分训练集、测试集  测试集占0.3

# DecisionTreeClassifier有多个参数可调,具体看官方文档
clf = tree.DecisionTreeClassifier(criterion="entropy")  # 载入决策树分类模型
clf = clf.fit(Xtrain, Ytrain)  # 决策树拟合,得到模型

score = clf.score(Xtest, Ytest)  # 返回预测的准确度
print("准确率:", score)

# 将得到的模型保存
with open("hwmx.dot", 'w') as f:
    f = tree.export_graphviz(clf, out_file=f)


# 将得到的模型生成pdf
dot_data = tree.export_graphviz(clf, out_file=None)
graph = graphviz.Source(dot_data)
graph.render("hwmx")
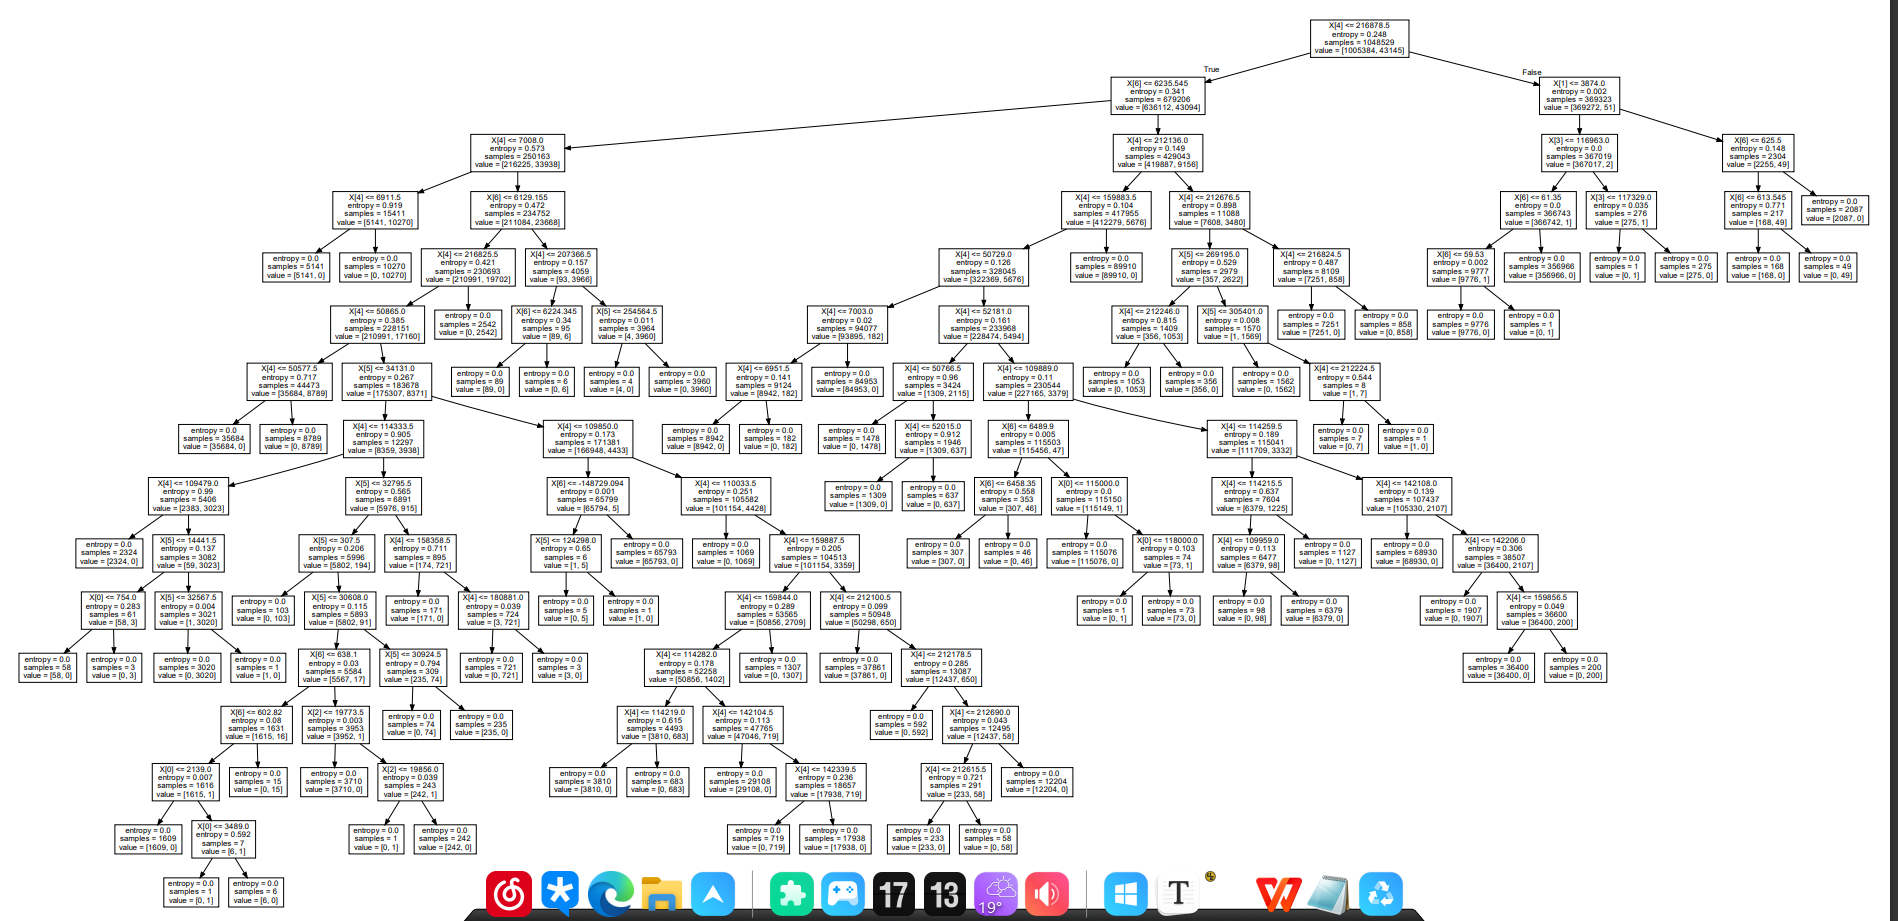
模型可视化

4.模型调优
基本没做
5.预测
# 预测
result = clf.predict(com_numpy)
temp = pd.DataFrame(result)
temp.to_csv(r'F:测试数据源	emp	empresult.csv', header=False)

# 获取公司
res = pd.read_csv(r'F:测试数据源	emp	empresult.csv', header=None, names=['id', 'Y/N'])

com = com.drop(labels={'数量', '单价', '金额', '税额', '购方代码', '价税合计'}, axis=1)
print(com.dtypes)
df = pd.merge(com, res, how="inner", on="id")

result = df[df['Y/N'] == 1]
# result是问题发票集,对企业id进行groupby分组获得所有问题企业id
result = result.groupby('销方代码')

print(result.groups.keys())
tempresult.csv内容中并没有公司id只有与com相对应的编号和预测返回的结果,例:
0 1
1 1
2 1
所以和com表拼接在一起并删除多余列获得最终的问题企业结果
"xf_id"
169749
147907
162258
27335
167426
110263
310054
134787
22901
216833
19765