NET Memory Profiler 查看内存使用情况
1 简介
.Net Memory Profiler(以下简称Profiler):专门针对于.NET程序,功能最全的内存分析工具,最大的特点是具有内存动态分析(Automatic Memory Analysis)功能。
2 安装
http://memprofiler.com/download.aspx
下载好后 直接下一步下一步
3 使用方法
支持7种类型.NET程序
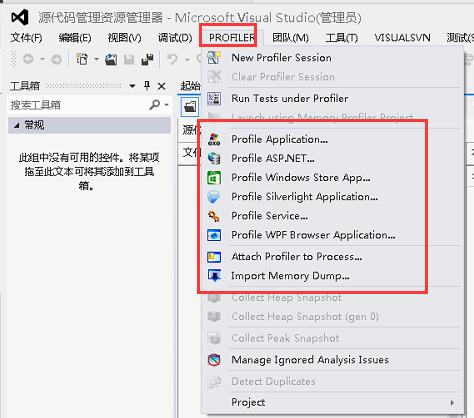
- 启动跟踪(Profiler Application)
选定对应的调试方式,如调试桌面程序,选中Profiler Application,然后选择需要启动的执行文件,Profiler将作为宿主程序启动程序开始实时监控内存.
- 附加进程(Attach Process)
将Profiler附加到指定的进程上,此时不能实时监控内存情况,只能够收集内存镜像.
- 导入内存镜像(Import Memory Dump)
可以选择dmp为后缀的内存镜像文件,比如Windbg以及DebugDiag导出的镜像文件,此时不能实时监控内存情况,只能够收集内存镜像且不能跟踪非托管资源.
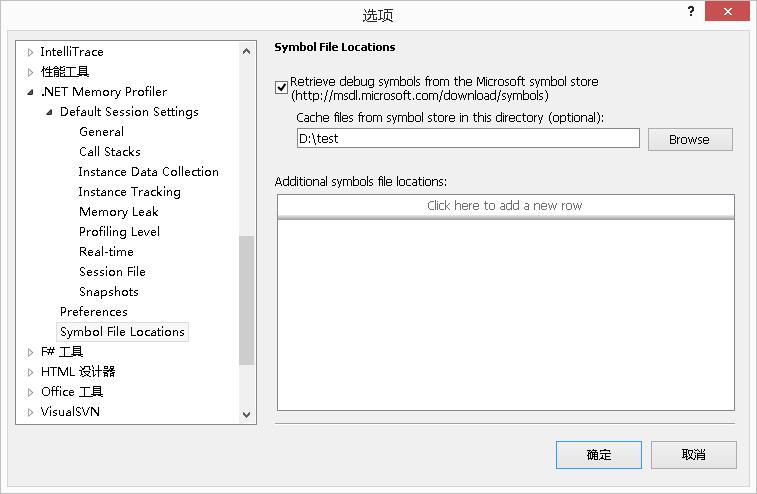
4 软件设置
为了加快Profiler分析内存类型实例的速度,需要设置程序的符号路径即(Symbol File Locations),进入菜单Tool->Options->Preferences->Symobl File Locations,得到弹出菜单如下图.
5 操作
首先,选择需要调试类型,选择 Profiler Application,选择好需要启动的程序exe文件.

选择级别

程序代码

using System;
using System.Collections.Generic;
using System.Linq;
using System.Text;
using Couchbase;
using Couchbase.Configuration;
using Enyim.Caching.Memcached;

namespace CentaNet.CouchbaseTest
{
    class Program
    {
        static void Main(string[] args)
        {
            int n = 0;
            while (true)
            {
                Console.WriteLine("=============第{0}次================", ++n);

                string Bucket = System.Configuration.ConfigurationManager.AppSettings["bucket"];
                string BucketPassword = Bucket;
                var key = "cottrell_brewing-old_yankee_ale" + DateTime.Now.ToString();
                Test(Bucket, BucketPassword, "http://10.4.18.13:8091/pools/default", key);
                Console.Write("
");
            }
        }

        static void Test(string Bucket, string BucketPassword, string url, string key)
        {
            var clientConfiguration = new CouchbaseClientConfiguration();
            clientConfiguration.Bucket = Bucket;
            clientConfiguration.BucketPassword = BucketPassword;
            clientConfiguration.Urls.Add(new Uri(url));
            clientConfiguration.SocketPool.ReceiveTimeout = new TimeSpan(0, 0, 111);
            clientConfiguration.SocketPool.ConnectionTimeout = new TimeSpan(0, 0, 111);
            clientConfiguration.SocketPool.DeadTimeout = new TimeSpan(0, 0, 111);
            var client = new CouchbaseClient(clientConfiguration);
            var result = client.Store(StoreMode.Set, key, "test");

            if (result)
            {
                var savedBeer = client.Get(key);
                Console.WriteLine(clientConfiguration.Urls[0].AbsoluteUri + "   " + savedBeer.ToString());
            }
            else
            {
                Console.WriteLine(clientConfiguration.Urls[0].AbsoluteUri + "   失败" );
            }

        }
    }
}
执行效果如下
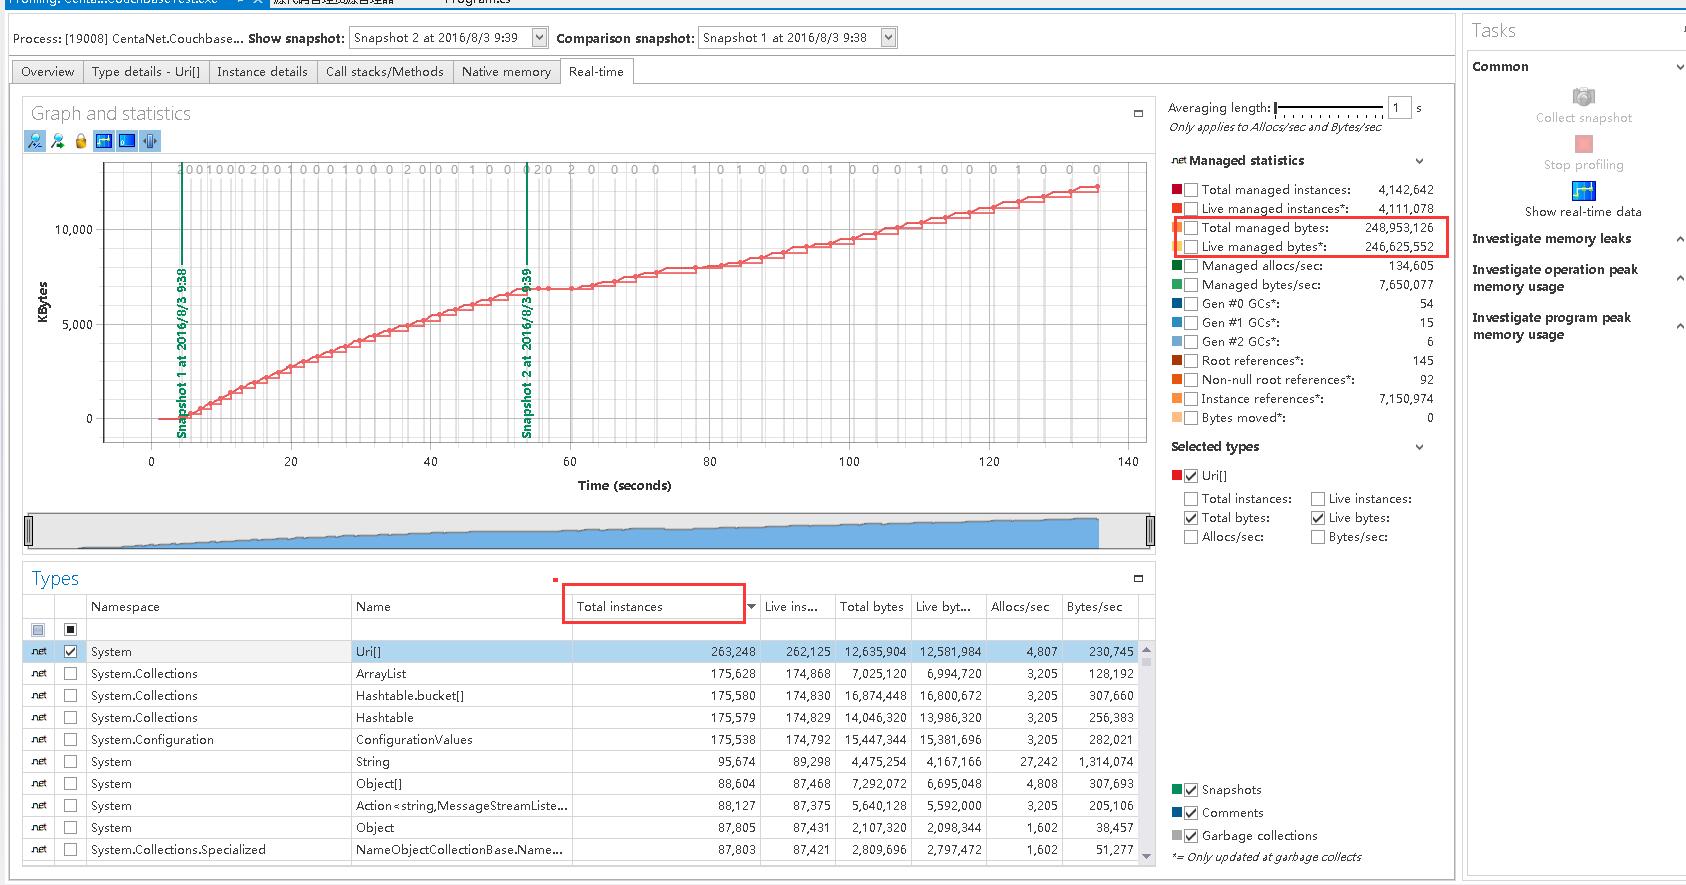
可以看到占用Uri资源实例是最多的
存储快照 分析原因


双击

可以看出造成URI实例原因是 couchbasepool 造成的,可以跟踪程序代码
Import Memory Dump
转存需要分析的dmp文件


需要下载SDK支持
https://developer.microsoft.com/en-us/windows/hardware/windows-driver-kit


可以看到内存的使用情况 分析溢出
推荐其他4款超实用的.NET性能分析工具
1.JetBrains dotTrace
JetBrains dotTrace是一款性能和内存分析工具,它可以帮助你优化应用程序性能指标,支持.NET 1.0版本到4.5,快速分析程序瓶颈,找出影响效率的代码。官方网站上面有10天试用版,大家可以点击下载使用。
2.ANTS Performance Profiler
ANTS性能分析器是一种用于分析.NET框架支持的用任何语言编写的应用程序的工具。ANTS性能分析器能分析所有.NET应用程序,包括ASP.NET网络应用程序、Windows服务和COM+应用程序。ANTS性能分析器能在几分钟内识别性能瓶颈,运行非常快速,且响应时,对程序的执行具有最低影响。ANTS性能分析器可用作一种独立工具,也可用作Red Gate .NET Developer Bundle的一部分。目前支持14天免费试用,大家可以去体验体验。
3.EQATEC Profiler
另一个非常好的.NET分析器,它拥有多个版本,有免费版,标准版、专业版等。不仅使用方便,而且优化速度也相当快。
4.Telerik Just Trace
Telerik Just Trace是一款帮你轻松找出内存泄漏的分析工具,并且可以轻松搞定许多性能问题。