第一个案例
首先开始来绘制你的第一个图表
from pyecharts import Bar
'''
遇到不懂的问题?Python学习交流群:1004391443满足你的需求,资料都已经上传群文件,可以自行下载!
'''
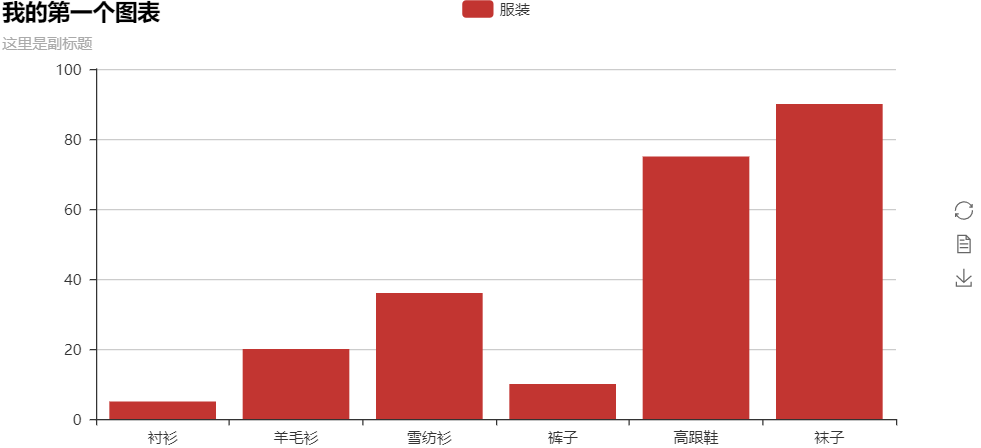
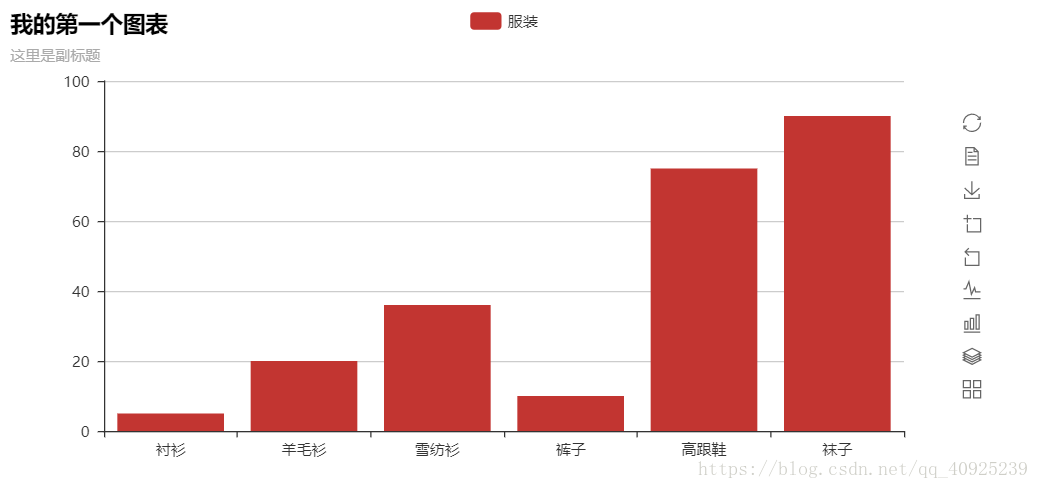
bar = Bar("我的第一个图表", "这里是副标题")
bar.add("服装", ["衬衫", "羊毛衫", "雪纺衫", "裤子", "高跟鞋", "袜子"], [5, 20, 36, 10, 75, 90])
# bar.print_echarts_options() # 该行只为了打印配置项,方便调试时使用
bar.render()    # 生成本地 HTML 文件
add()
主要方法,用于添加图表的数据和设置各种配置项
print_echarts_options()
打印输出图表的所有配置项
render()
默认将会在根目录下生成一个 render.html 的文件,支持 path 参数,设置文件保存位置,如 render(r”e:my_first_chart.html”),文件用浏览器打开。
Note: 可以按右边的下载按钮将图片下载到本地,如果想要提供更多实用工具按钮,请在 add() 中设置 is_more_utils 为 True
from pyecharts import Bar

bar = Bar("我的第一个图表", "这里是副标题")
bar.add("服装",
        ["衬衫", "羊毛衫", "雪纺衫", "裤子", "高跟鞋", "袜子"], [5, 20, 36, 10, 75, 90],
        is_more_utils=True)
bar.render()
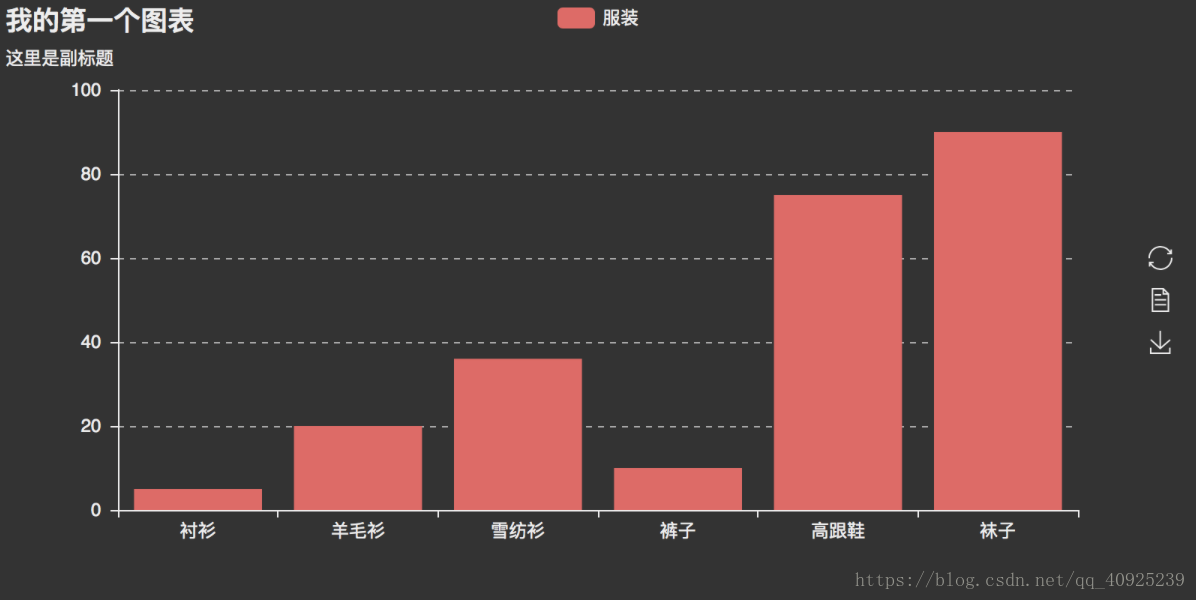
使用主题
from pyecharts import Bar

bar = Bar("我的第一个图表", "这里是副标题")
bar.use_theme('dark')
bar.add("服装", ["衬衫", "羊毛衫", "雪纺衫", "裤子", "高跟鞋", "袜子"], [5, 20, 36, 10, 75, 90])
bar.render()
使用 pyecharts-snapshot 插件
如果想直接将图片保存为 png, pdf, gif 格式的文件,可以使用 pyecharts-snapshot。使用该插件请确保你的系统上已经安装了 Nodejs 环境。
安装phantomjs
$ npm install -g phantomjs-prebuilt安装pyecharts-snapshot
$ pip install pyecharts-snapshot
调用 render 方法 bar.render(path=’snapshot.png’) 文件结尾可以为 svg/jpeg/png/pdf/gif。
请注意,svg 文件需要你在初始化 bar 的时候设置 renderer=’svg’。
多次显示图表
from pyecharts import Bar, Line
from pyecharts.engine import create_default_environment

bar = Bar("我的第一个图表", "这里是副标题")
bar.add("服装", ["衬衫", "羊毛衫", "雪纺衫", "裤子", "高跟鞋", "袜子"], [5, 20, 36, 10, 75, 90])

line = Line("我的第一个图表", "这里是副标题")
line.add("服装", ["衬衫", "羊毛衫", "雪纺衫", "裤子", "高跟鞋", "袜子"], [5, 20, 36, 10, 75, 90])

env = create_default_environment("html")
# 为渲染创建一个默认配置环境
# create_default_environment(filet_ype)
# file_type: 'html', 'svg', 'png', 'jpeg', 'gif' or 'pdf'

env.render_chart_to_file(bar, path='bar.html')
env.render_chart_to_file(line, path='line.html')
相比第一个例子,该代码只是使用同一个引擎对象,减少了部分重复操作,速度有所提高。