应用groupby和聚合函数实现数据的分组与聚合
什么分组与聚合

分组API
DataFrame.groupby(key, as_index=False)
key:分组的列数据,可以多个
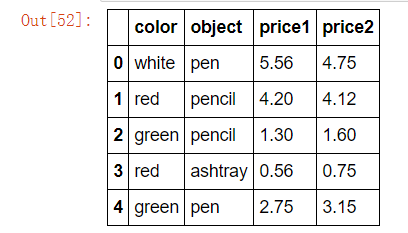
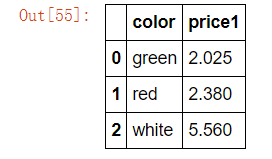
案例:不同颜色的不同笔的价格数据
col =pd.DataFrame({'color': ['white','red','green','red','green'], 'object': ['pen','pencil','pencil','ashtray','pen'],'price1':[5.56,4.20,1.30,0.56,2.75],'price2':[4.75,4.12,1.60,0.75,3.15]})
col
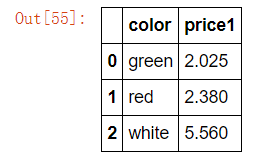
col.groupby(["color"])["price1"].mean()      #dataframe
#或
col['price1'].groupby(col['color']).mean() #serise
# 分组,数据的结构不变
col.groupby(['color'], as_index=False)['price1'].mean()
案例:
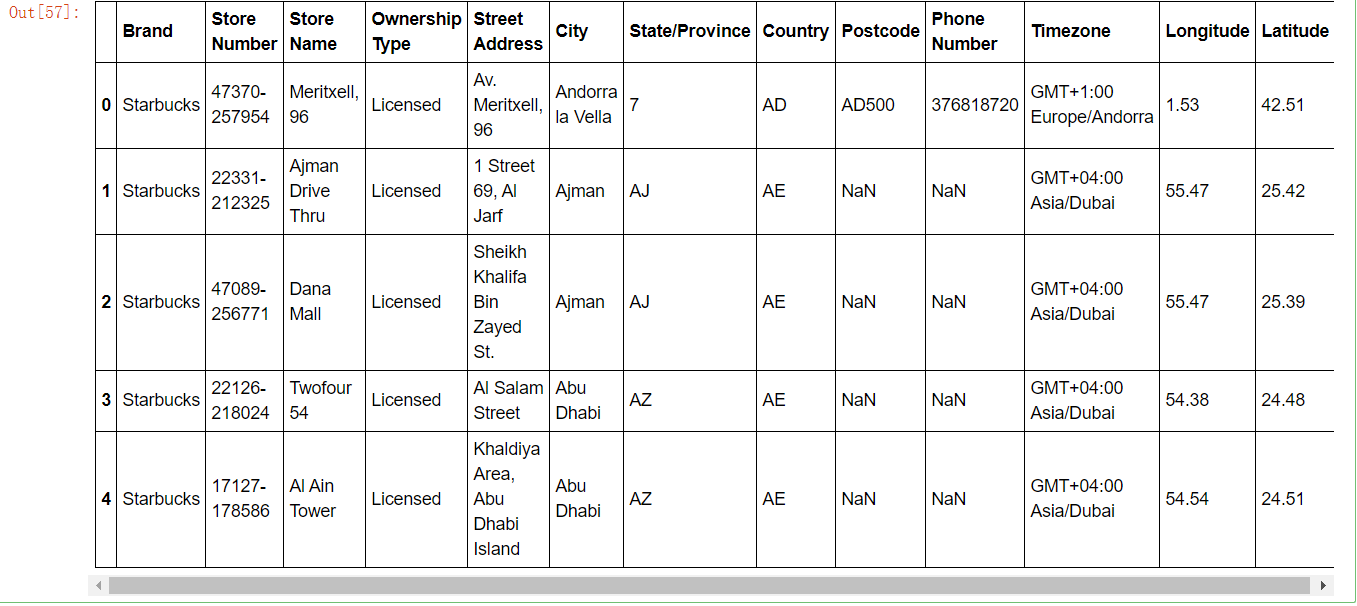
星巴克零售店铺数据
现在我们有一组关于全球星巴克店铺的统计数据,如果我想知道美国的星巴克数量和中国的哪个多,或者我想知道中国每个省份星巴克的数量的情况,那么应该怎么办?
数据来源:https://www.kaggle.com/starbucks/store-locations/data
数据获取
从文件中读取星巴克店铺数据
# 导入星巴克店的数据
starbucks = pd.read_csv("./data/starbucks/directory.csv")
starbucks.head()
进行分组聚合
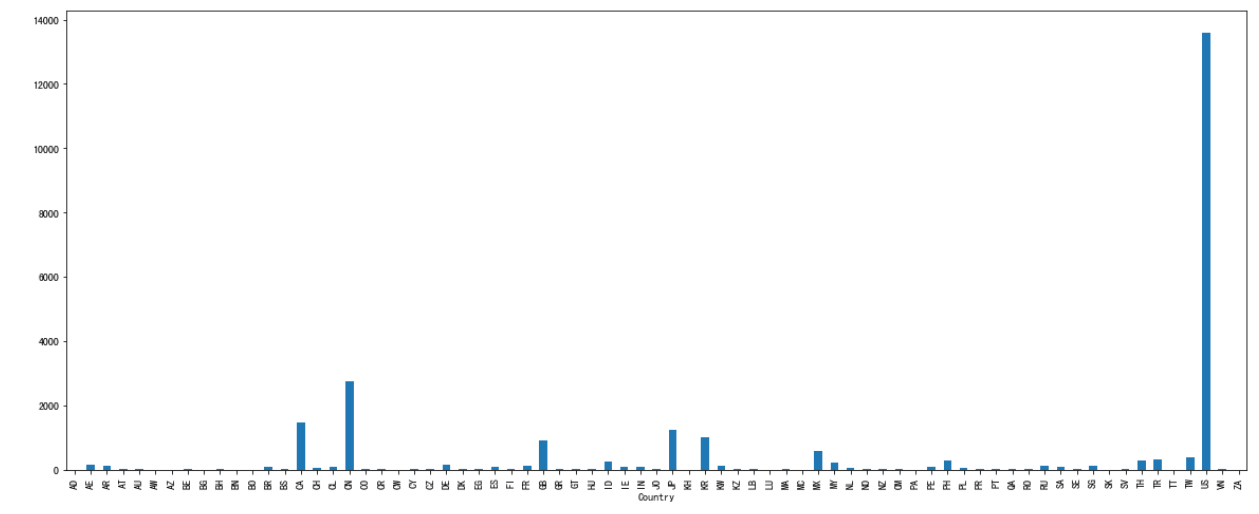
# 按照国家分组,求出每个国家的星巴克零售店数量
count = starbucks.groupby(['Country']).count()
count['Brand'].plot(kind='bar', figsize=(20, 8))
plt.show()
假设我们加入省市一起进行分组
# 设置多个索引,set_index()
starbucks.groupby(['Country', 'State/Province']).count()
| Brand | Store Number | Store Name | Ownership Type | Street Address | City | Postcode | Phone Number | Timezone | Longitude | Latitude | ||
|---|---|---|---|---|---|---|---|---|---|---|---|---|
| Country | State/Province | |||||||||||
| AD | 7 | 1 | 1 | 1 | 1 | 1 | 1 | 1 | 1 | 1 | 1 | 1 |
| AE | AJ | 2 | 2 | 2 | 2 | 2 | 2 | 0 | 0 | 2 | 2 | 2 |
| AZ | 48 | 48 | 48 | 48 | 48 | 48 | 7 | 20 | 48 | 48 | 48 | |
| DU | 82 | 82 | 82 | 82 | 82 | 82 | 16 | 50 | 82 | 82 | 82 | |
| FU | 2 | 2 | 2 | 2 | 2 | 2 | 1 | 0 | 2 | 2 | 2 | |
| RK | 3 | 3 | 3 | 3 | 3 | 3 | 0 | 3 | 3 | 3 | 3 | |
| SH | 6 | 6 | 6 | 6 | 6 | 6 | 0 | 5 | 6 | 6 | 6 | |
| UQ | 1 | 1 | 1 | 1 | 1 | 1 | 0 | 0 | 1 | 1 | 1 | |
| AR | B | 21 | 21 | 21 | 21 | 21 | 21 | 18 | 5 | 21 | 21 | 21 |
| C | 73 | 73 | 73 | 73 | 73 | 73 | 71 | 24 | 73 | 73 | 73 | |
| M | 5 | 5 | 5 | 5 | 5 | 5 | 2 | 0 | 5 | 5 | 5 | |
| S | 3 | 3 | 3 | 3 | 3 | 3 | 3 | 0 | 3 | 3 | 3 | |
| X | 6 | 6 | 6 | 6 | 6 | 6 | 6 | 0 | 6 | 6 | 6 | |
| AT | 3 | 1 | 1 | 1 | 1 | 1 | 1 | 1 | 1 | 1 | 1 | 1 |
| 5 | 3 | 3 | 3 | 3 | 3 | 3 | 3 | 3 | 3 | 3 | 3 | |
| 9 | 14 | 14 | 14 | 14 | 14 | 14 | 14 | 13 | 14 | 14 | 14 | |
| AU | NSW | 9 | 9 | 9 | 9 | 9 | 9 | 9 | 0 | 9 | 9 | 9 |
| QLD | 8 | 8 | 8 | 8 | 8 | 8 | 8 | 0 | 8 | 8 | 8 | |
| VIC | 5 | 5 | 5 | 5 | 5 | 5 | 5 | 0 | 5 | 5 | 5 | |
| AW | AW | 3 | 3 | 3 | 3 | 3 | 3 | 0 | 3 | 3 | 3 | 3 |
| AZ | BA | 3 | 3 | 3 | 3 | 3 | 3 | 2 | 3 | 3 | 3 | 3 |
| SAB | 1 | 1 | 1 | 1 | 1 | 1 | 1 | 1 | 1 | 1 | 1 | |
| BE | BE | 4 | 4 | 4 | 4 | 4 | 4 | 4 | 0 | 4 | 4 | 4 |
| VAN | 1 | 1 | 1 | 1 | 1 | 1 | 1 | 0 | 1 | 1 | 1 | |
| VBR | 2 | 2 | 2 | 2 | 2 | 2 | 2 | 0 | 2 | 2 | 2 | |
| VLG | 10 | 10 | 10 | 10 | 10 | 10 | 10 | 1 | 10 | 10 | 10 | |
| WAL | 2 | 2 | 2 | 2 | 2 | 2 | 2 | 0 | 2 | 2 | 2 | |
| BG | 2 | 1 | 1 | 1 | 1 | 1 | 1 | 0 | 0 | 1 | 1 | 1 |
| 23 | 4 | 4 | 4 | 4 | 4 | 4 | 1 | 0 | 4 | 4 | 4 | |
| BH | 13 | 16 | 16 | 16 | 16 | 16 | 16 | 2 | 10 | 16 | 16 | 16 |
| ... | ... | ... | ... | ... | ... | ... | ... | ... | ... | ... | ... | ... |
| US | MO | 188 | 188 | 188 | 188 | 188 | 188 | 188 | 175 | 188 | 188 | 188 |
| MS | 32 | 32 | 32 | 32 | 32 | 32 | 32 | 28 | 32 | 32 | 32 | |
| MT | 36 | 36 | 36 | 36 | 36 | 36 | 36 | 36 | 36 | 36 | 36 | |
| NC | 338 | 338 | 338 | 338 | 338 | 338 | 338 | 322 | 338 | 338 | 338 | |
| ND | 13 | 13 | 13 | 13 | 13 | 13 | 13 | 13 | 13 | 13 | 13 | |
| NE | 58 | 58 | 58 | 58 | 58 | 58 | 58 | 56 | 58 | 58 | 58 | |
| NH | 29 | 29 | 29 | 29 | 29 | 29 | 29 | 27 | 29 | 29 | 29 | |
| NJ | 261 | 261 | 261 | 261 | 261 | 261 | 261 | 250 | 261 | 261 | 261 | |
| NM | 76 | 76 | 76 | 76 | 76 | 76 | 76 | 75 | 76 | 76 | 76 | |
| NV | 253 | 253 | 253 | 253 | 253 | 253 | 253 | 230 | 253 | 253 | 253 | |
| NY | 645 | 645 | 645 | 645 | 645 | 645 | 645 | 627 | 645 | 645 | 645 | |
| OH | 378 | 378 | 378 | 378 | 378 | 378 | 377 | 357 | 378 | 378 | 378 | |
| OK | 79 | 79 | 79 | 79 | 79 | 79 | 79 | 76 | 79 | 79 | 79 | |
| OR | 359 | 359 | 359 | 359 | 359 | 359 | 359 | 343 | 359 | 359 | 359 | |
| PA | 357 | 357 | 357 | 357 | 357 | 357 | 357 | 350 | 357 | 357 | 357 | |
| RI | 27 | 27 | 27 | 27 | 27 | 27 | 27 | 27 | 27 | 27 | 27 | |
| SC | 131 | 131 | 131 | 131 | 131 | 131 | 131 | 125 | 131 | 131 | 131 | |
| SD | 25 | 25 | 25 | 25 | 25 | 25 | 25 | 25 | 25 | 25 | 25 | |
| TN | 180 | 180 | 180 | 180 | 180 | 180 | 180 | 162 | 180 | 180 | 180 | |
| TX | 1042 | 1042 | 1042 | 1042 | 1042 | 1042 | 1042 | 1002 | 1042 | 1042 | 1042 | |
| UT | 101 | 101 | 101 | 101 | 101 | 101 | 101 | 99 | 101 | 101 | 101 | |
| VA | 432 | 432 | 432 | 432 | 432 | 432 | 432 | 413 | 432 | 432 | 432 | |
| VT | 8 | 8 | 8 | 8 | 8 | 8 | 8 | 8 | 8 | 8 | 8 | |
| WA | 757 | 757 | 757 | 757 | 757 | 757 | 757 | 738 | 757 | 757 | 757 | |
| WI | 145 | 145 | 145 | 145 | 145 | 145 | 145 | 144 | 145 | 145 | 145 | |
| WV | 25 | 25 | 25 | 25 | 25 | 25 | 25 | 23 | 25 | 25 | 25 | |
| WY | 23 | 23 | 23 | 23 | 23 | 23 | 23 | 22 | 23 | 23 | 23 | |
| VN | HN | 6 | 6 | 6 | 6 | 6 | 6 | 6 | 6 | 6 | 6 | 6 |
| SG | 19 | 19 | 19 | 19 | 19 | 19 | 19 | 17 | 19 | 19 | 19 | |
| ZA | GT | 3 | 3 | 3 | 3 | 3 | 3 | 3 | 2 | 3 | 3 | 3 |
545 rows × 11 columns
仔细观察这个结构,与我们前面讲的哪个结构类似??
与前面的MultiIndex结构类似
电影数据案例分析:
需求
现在我们有一组从2006年到2016年1000部最流行的电影数据
数据来源:https://www.kaggle.com/damianpanek/sunday-eda/data
- 问题1:我们想知道这些电影数据中评分的平均分,导演的人数等信息,我们应该怎么获取?
- 问题2:对于这一组电影数据,如果我们想rating,runtime的分布情况,应该如何呈现数据?
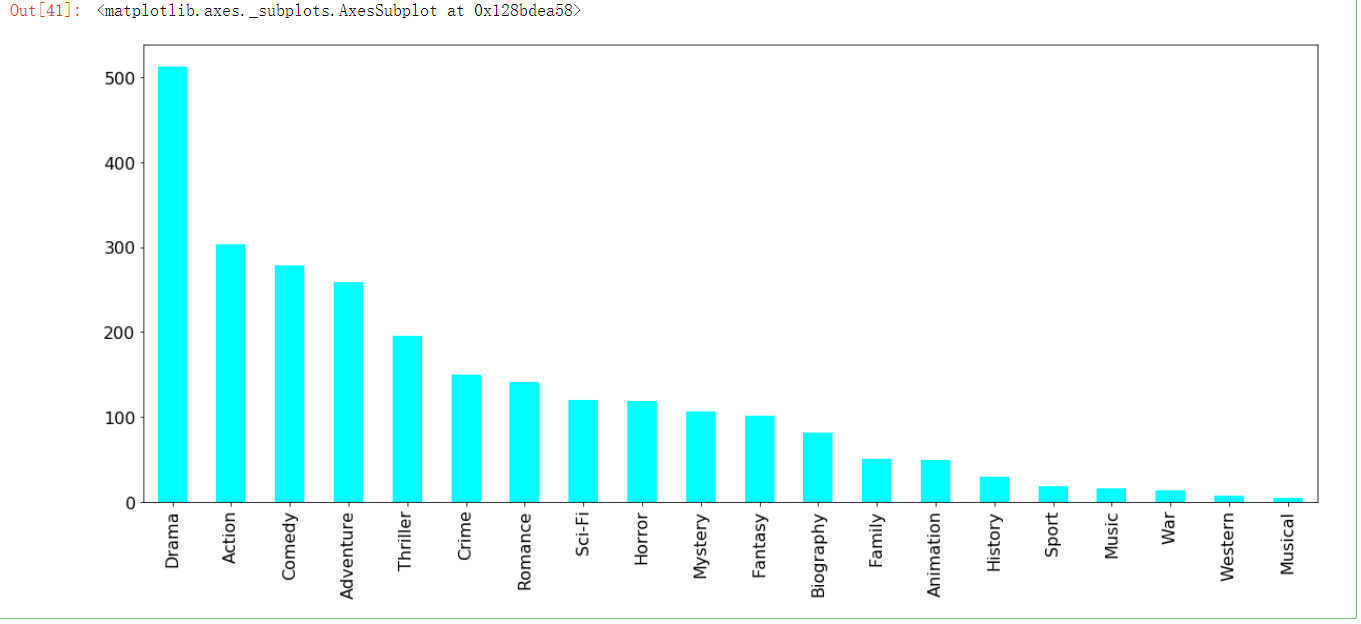
- 问题3:对于这一组电影数据,如果我们希望统计电影分类(genre)的情况,应该如何处理数据?
导入数据:
import numpy as np
import pandas as pd
import matplotlib.pyplot as plt
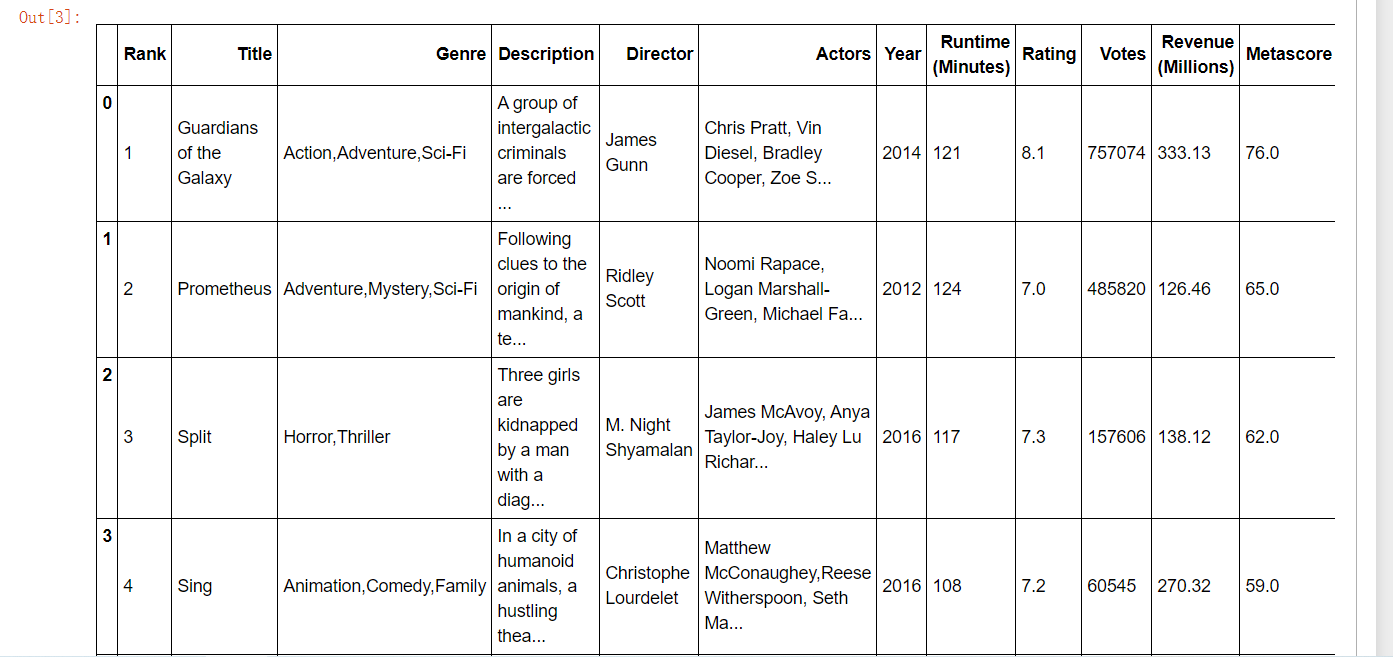
movie = pd.read_csv("./data/IMDB-Movie-Data.csv")
movie.head()
问题一:
我们想知道这些电影数据中评分的平均分,导演的人数等信息,我们应该怎么获取?
得出评分的平均分 ------------使用mean函数
movie["Rating"].mean()

得出导演人数信息
求出唯一值,然后进行形状获取
np.unique(movie["Director"]).shape[0]

问题二:
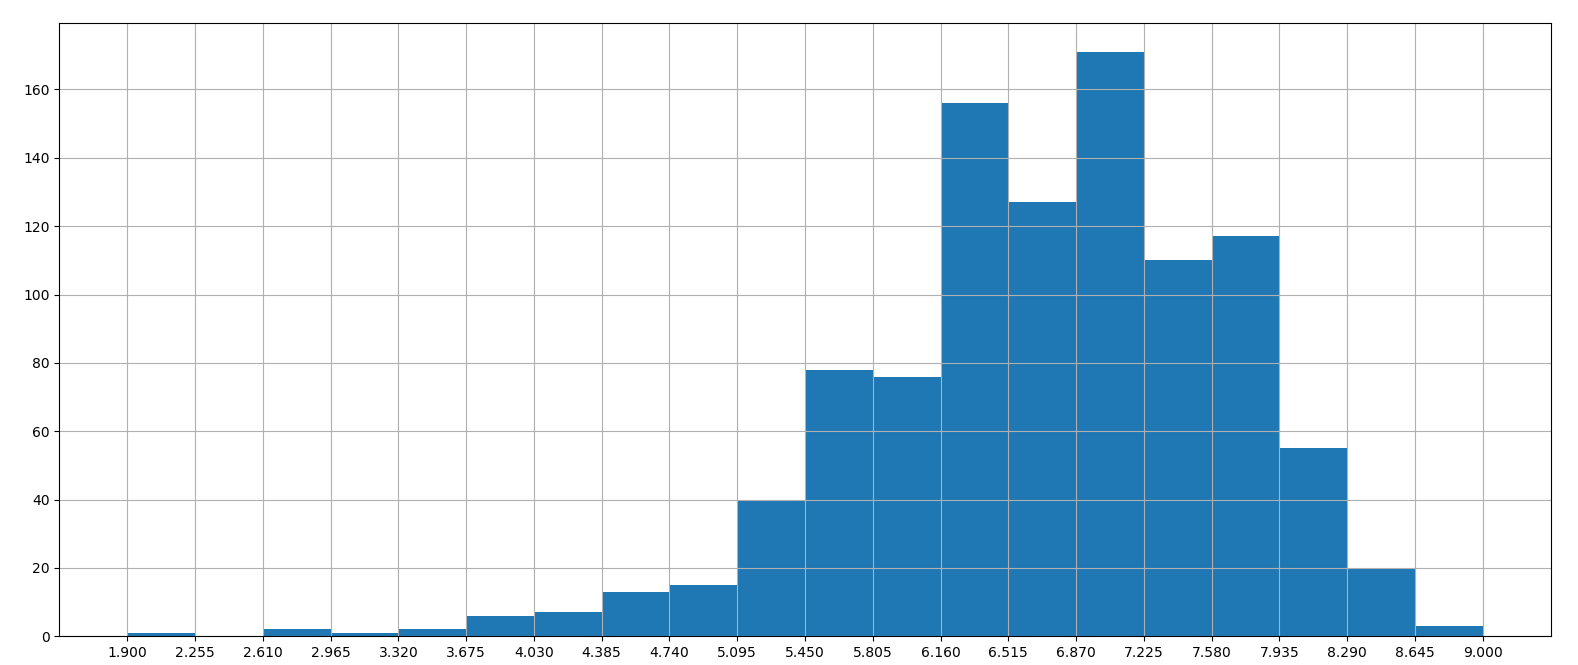
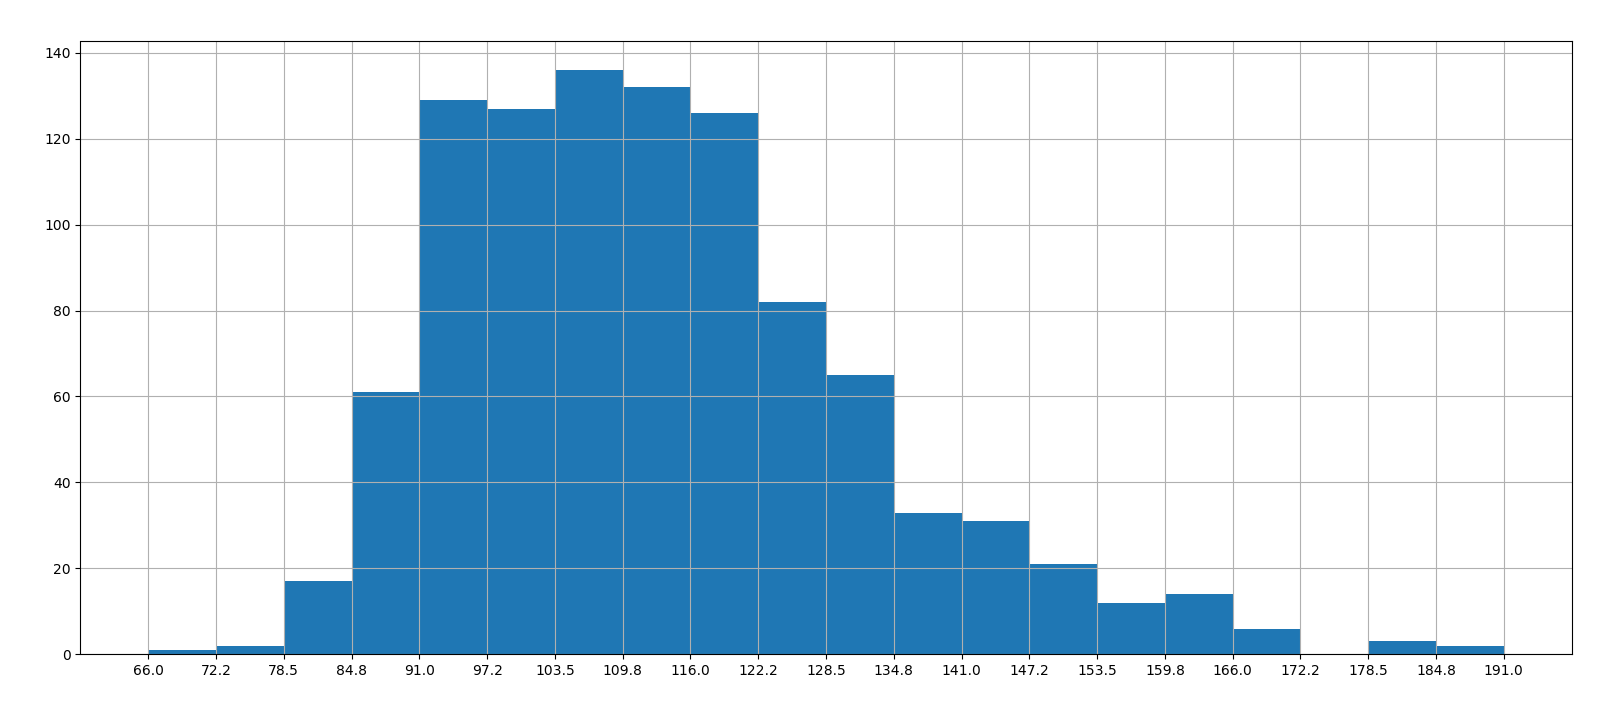
对于这一组电影数据,如果我们想Rating,Runtime (Minutes)的分布情况,应该如何呈现数据?
- 直接呈现,以直方图的形式
# Rating分布

movie["Rating"].plot(kind="hist",figsize=(20,8))

这样的直方图刻度不会对齐,不明显
于是:
# Rating分布
# 1.创建画布
plt.figure(figsize=(20, 8), dpi=100)
# 2.绘制图像
plt.hist(movie["Rating"].values, bins=20)
# 2.1 添加刻度
max_ = movie["Rating"].max()
min_ = movie["Rating"].min()
t1 = np.linspace(min_, max_, num=21)
plt.xticks(t1)
# 2.2 添加网格
plt.grid()
# 3.显示
plt.show()
# Runtime (Minutes)分布

# 1.创建画布
plt.figure(figsize=(20, 8), dpi=100)

# 2.绘制图像
plt.hist(movie["Runtime (Minutes)"].values, bins=20)

# 2.1 添加刻度
max_ = movie["Runtime (Minutes)"].max()
min_ = movie["Runtime (Minutes)"].min()

t1 = np.linspace(min_, max_, num=21)

plt.xticks(t1)

# 2.2 添加网格
plt.grid()

# 3.显示
plt.show()
问题三:
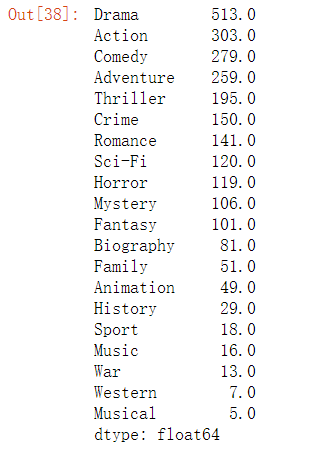
对于这一组电影数据,如果我们希望统计电影分类(genre)的情况,应该如何处理数据?
思路
- 1、创建一个全为0的dataframe,列索引置为电影的分类,temp_df
- 2、遍历每一部电影,temp_df中把分类出现的列的值置为1
- 3、求和
创建一个全为0的dataframe,列索引置为电影的分类,temp_df
# 进行字符串分割
temp_list = [i.split(",") for i in df["Genre"]]
temp_list

# 获取电影的分类
genre_list = np.unique([i for j in temp_list for i in j])
genre_list

# 增加新的列
temp_df = pd.DataFrame(np.zeros([df.shape[0],genre_list.shape[0]]),columns=genre_list)

遍历每一部电影,temp_df中把分类出现的列的值置为1
for i in range(1000):
    temp_movie.ix[i, temp_list[i]] = 1
temp_movie.head()

求和,绘图
genre = temp_movie.sum().sort_values(ascending=False) #ascending=False是降序
genre
genre.plot(kind="bar", colormap="cool", figsize=(20, 8), fontsize=16)
