ELK 安装配置简单,用于管理 OpenStack 日志时需注意两点:
- Logstash 配置文件的编写
- Elasticsearch 日志存储空间的容量规划
另外推荐 ELKstack 中文指南。
ELK 简介
ELK 是一套优秀的日志搜集、存储和查询的开源软件,广泛用于日志系统。当 OpenStack 集群达到一定规模时,日志管理和分析显得日益重要,良好统一的日志管理和分析平台有助于快速定位问题。Mirantis 的 fuel 和 HPE 的 helion 均集成了 ELK。
- Logstash:日志的收集和传送
- Elasticsearch:日志的存储和检索
- Kibana:日志的可视化,一个很炫的 portal
采用 ELK 管理 OpenStack 的日志具有以下优点:
- 迅速查询全局 ERROR 级别日志
- 某个 API 的请求频率
- 通过 request ID, 可过滤出某个 API 整个流程的日志
规划与设计
部署架构
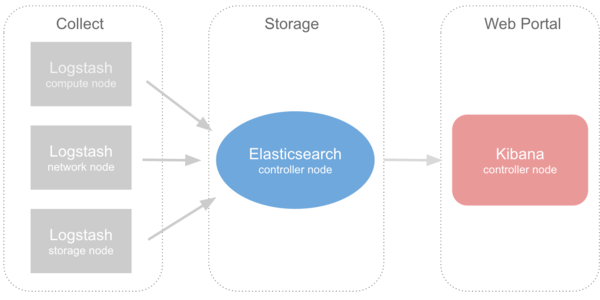
控制节点作为日志服务器,存储所有 OpenStack 及其相关日志。Logstash 部署于所有节点,收集本节点下所需收集的日志,然后以网络(node/http)方式输送给控制节点的 Elasticsearch,Kibana 作为 web portal 提供展示日志信息:
日志格式
为了提供快速直观的检索功能,对于每一条 OpenStack 日志,我们希望它能包含以下属性,用于检索和过滤:
- Host: 如 controller01,compute01 等
- Service Name: 如 nova-api, neutron-server 等
- Module: 如 nova.filters
- Log Level: 如 DEBUG, INFO, ERROR 等
- Log date
- Request ID: 某次请求的 Request ID
以上属性可以通过 Logstash 实现,通过提取日志的关键字段,从而获上述几种属性,并在 Elasticsearch 建立索引。
安装与配置
安装
ELK 的安装步骤非常简单,可参考 logstash-es-Kibana 安装,如遇异常,请 Google。
配置
Logstash 的配置文件有专门的一套语法,学习的成本比较高,可参考 openstack logstash config 后,再根据自身需求改写:
input {
  file {
    path => ['/var/log/nova/nova-api.log']
    tags => ['nova', 'oslofmt']
    type => "nova-api"
  }
  file {
    path => ['/var/log/nova/nova-conductor.log']
    tags => ['nova-conductor', 'oslofmt']
    type => "nova"
  }
  file {
    path => ['/var/log/nova/nova-manage.log']
    tags => ['nova-manage', 'oslofmt']
    type => "nova"
  }
  file {
    path => ['/var/log/nova/nova-scheduler.log']
    tags => ['nova-scheduler', 'oslofmt']
    type => "nova"
  }
  file {
    path => ['/var/log/nova/nova-spicehtml5proxy.log']
    tags => ['nova-spice', 'oslofmt']
    type => "nova"
  }
  file {
    path => ['/var/log/keystone/keystone-all.log']
    tags => ['keystone', 'keystonefmt']
    type => "keystone"
  }
  file {
    path => ['/var/log/keystone/keystone-manage.log']
    tags => ['keystone', 'keystonefmt']
    type => "keystone"
  }
  file {
    path => ['/var/log/glance/api.log']
    tags => ['glance', 'oslofmt']
    type => "glance-api"
  }
  file {
    path => ['/var/log/glance/registry.log']
    tags => ['glance', 'oslofmt']
    type => "glance-registry"
  }
  file {
    path => ['/var/log/glance/scrubber.log']
    tags => ['glance', 'oslofmt']
    type => "glance-scrubber"
  }
  file {
    path => ['/var/log/ceilometer/ceilometer-agent-central.log']
    tags => ['ceilometer', 'oslofmt']
    type => "ceilometer-agent-central"
  }
  file {
    path => ['/var/log/ceilometer/ceilometer-alarm-notifier.log']
    tags => ['ceilometer', 'oslofmt']
    type => "ceilometer-alarm-notifier"
  }
  file {
    path => ['/var/log/ceilometer/ceilometer-api.log']
    tags => ['ceilometer', 'oslofmt']
    type => "ceilometer-api"
  }
  file {
    path => ['/var/log/ceilometer/ceilometer-alarm-evaluator.log']
    tags => ['ceilometer', 'oslofmt']
    type => "ceilometer-alarm-evaluator"
  }
  file {
    path => ['/var/log/ceilometer/ceilometer-collector.log']
    tags => ['ceilometer', 'oslofmt']
    type => "ceilometer-collector"
  }
  file {
    path => ['/var/log/heat/heat.log']
    tags => ['heat', 'oslofmt']
    type => "heat"
  }
  file {
    path => ['/var/log/neutron/neutron-server.log']
    tags => ['neutron', 'oslofmt']
    type => "neutron-server"
  }
# Not collecting RabbitMQ logs for the moment
#  file {
#   path => ['/var/log/rabbitmq/rabbit@<%= @hostname %>.log']
#   tags => ['rabbitmq', 'oslofmt']
#   type => "rabbitmq"
#  }
  file {
    path => ['/var/log/httpd/access_log']
    tags => ['horizon']
    type => "horizon"
  }
  file {
    path => ['/var/log/httpd/error_log']
    tags => ['horizon']
    type => "horizon"
  }
  file {
    path => ['/var/log/httpd/horizon_access_log']
    tags => ['horizon']
    type => "horizon"
  }
  file {
    path => ['/var/log/httpd/horizon_error_log']
    tags => ['horizon']
    type => "horizon"
  }
}
filter {
  if "oslofmt" in [tags] {
    multiline {
      negate => true
      pattern => "^%{TIMESTAMP_ISO8601} "
      what => "previous"
    }
    multiline {
      negate => false
      pattern => "^%{TIMESTAMP_ISO8601}%{SPACE}%{NUMBER}?%{SPACE}?TRACE"
      what => "previous"
    }
    grok {
      # Do multiline matching as the above mutliline filter may add newlines
      # to the log messages.
      # TODO move the LOGLEVELs into a proper grok pattern.
      match => { "message" => "(?m)^%{TIMESTAMP_ISO8601:logdate}%{SPACE}%{NUMBER:pid}?%{SPACE}?(?<loglevel>AUDIT|CRITICAL|DEBUG|INFO|TRACE|WARNING|ERROR) [?%{NOTSPACE:module}]?%{SPACE}?%{GREEDYDATA:logmessage}?" }
      add_field => { "received_at" => "%{@timestamp}" }
    }
  } else if "keystonefmt" in [tags] {
    grok {
      # Do multiline matching as the above mutliline filter may add newlines
      # to the log messages.
      # TODO move the LOGLEVELs into a proper grok pattern.
      match => { "message" => "(?m)^%{TIMESTAMP_ISO8601:logdate}%{SPACE}%{NUMBER:pid}?%{SPACE}?(?<loglevel>AUDIT|CRITICAL|DEBUG|INFO|TRACE|WARNING|ERROR) [?%{NOTSPACE:module}]?%{SPACE}?%{GREEDYDATA:logmessage}?" }
      add_field => { "received_at" => "%{@timestamp}" }
    }
    if [module] == "iso8601.iso8601" {
  #log message for each part of the date?  Really?
  drop {}
    }
  } else if "libvirt" in [tags] {
    grok {
       match => { "message" => "(?m)^%{TIMESTAMP_ISO8601:logdate}:%{SPACE}%{NUMBER:code}:?%{SPACE}[?%{NOTSPACE:loglevel}]?%{SPACE}?:?%{SPACE}[?%{NOTSPACE:module}]?%{SPACE}?%{GREEDYDATA:logmessage}?" }
       add_field => { "received_at" => "%{@timestamp}"}
    }
    mutate {
       uppercase => [ "loglevel" ]
    }
  } else if [type] == "syslog" {
     grok {
        match => { "message" => "%{SYSLOGTIMESTAMP:syslog_timestamp} %{SYSLOGHOST:syslog_hostname} %{DATA:syslog_program}(?:[%{POSINT:syslog_pid}])?: %{GREEDYDATA:logmessage}" }
        add_field => [ "received_at", "%{@timestamp}" ]
     }
     syslog_pri {
        severity_labels => ["ERROR", "ERROR", "ERROR", "ERROR", "WARNING", "INFO", "INFO", "DEBUG" ]
     }
     date {
        match => [ "syslog_timestamp", "MMM  d HH:mm:ss", "MMM dd HH:mm:ss" ]
     }
     if !("_grokparsefailure" in [tags]) {
        mutate {
           replace => [ "@source_host", "%{syslog_hostname}" ]
        }
     }
     mutate {
        remove_field => [ "syslog_hostname", "syslog_timestamp" ]
        add_field => [ "loglevel", "%{syslog_severity}" ]
        add_field => [ "module", "%{syslog_program}" ]
     }
  }
}

output {
    elasticsearch { host => controller }
}
openstack.org用来观察infra
http://logstash.openstack.org/#/dashboard/file/logstash.json
http://docs.openstack.org/infra/system-config/logstash.html
把ceilometer的数据发送到ELK
http://www.brownhat.org/wp/2014/09/18/openstack-logstash-and-elasticsearch-living-on-the-edge/