Pytorch Guided Backpropgation
Intro
guided backpropgation通过修改RELU的梯度反传,使得小于0的部分不反传,只传播大于0的部分,这样到第一个conv层的时候得到的梯度就是对后面relu激活起作用的梯度,这时候我们对这些梯度进行可视化,得到的就是对网络起作用的区域。(实际上可视化的是梯度)。
简单记一下。用到hook的神经网络可视化方法。
code
import torch
import torch.nn as nn
from torchvision import transforms,models
import re
from models.densenet import densenet121
from PIL import Image
import numpy as np
import matplotlib.pyplot as plt
class Guided_Prop():
    def __init__(self,model):
        self.model = model
        self.model.eval()
        self.out_img = None
        self.activation_maps = []

    def register_hooks(self):
        def register_first_layer_hook(module,grad_in,grad_out):
            self.out_img = grad_in[0] #(b,c,h,w) -> (c,h,w)
        def forward_hook_fn(module,input_feature,output_feature):
            self.activation_maps.append(output_feature)
        def backward_hook_fn(module,grad_in,grad_out):
            grad = self.activation_maps.pop()
            grad[grad > 0] = 1
            g_positive = torch.clamp(grad_out[0],min = 0.)
            result_grad = grad * g_positive
            return (result_grad,)

        modules = list(self.model.features.named_children())
        for name,module in modules:
            if isinstance(module,nn.ReLU):
                module.register_forward_hook(forward_hook_fn)
                module.register_backward_hook(backward_hook_fn)
        first_layer = modules[0][1]
        first_layer.register_backward_hook(register_first_layer_hook)

    def visualize(self,input_image):
        softmax = nn.Softmax(dim = 1)
        idx_tensor = torch.tensor([float(i) for i in range(61)])
        self.register_hooks()
        self.model.zero_grad()
        out = self.model(input_image) # [[b,n],[b,n],[b,n]]
        yaw = softmax(out[0])
        yaw = torch.sum(yaw * idx_tensor,dim = 1) * 3 - 90.
        pitch = softmax(out[1])
        pitch = torch.sum(pitch * idx_tensor,dim = 1) * 3 - 90.
        roll = softmax(out[2])
        roll = torch.sum(roll * idx_tensor,dim = 1) * 3 - 90.


        #print(yaw)
        out = yaw + pitch + roll
        out.backward()
        result = self.out_img.data[0].permute(1,2,0) # chw -> hwc(opencv)
        return result.numpy()
def normalize(I):
    norm = (I-I.mean())/I.std()
    norm = norm * 0.1
    norm = norm + 0.5
    norm = norm.clip(0, 1)
    return norm
if __name__ == "__main__":
    input_size = 224
    model = densenet121(pretrained = False,num_classes = 61)
    model.load_state_dict(torch.load("./ckpt/DenseNet/model_2692_.pkl"))

    img = Image.open("/media/xueaoru/其他/ML/head_pose_work/brick/head_and_heads/test/BIWI00009409_-17_+1_+17.png")
    transform = transforms.Compose([
        transforms.Resize(input_size),
        transforms.CenterCrop(input_size),
        transforms.ToTensor(),
        transforms.Normalize([0.485, 0.456, 0.406], [0.229, 0.224, 0.225])
    ])
    tensor  = transform(img).unsqueeze(0).requires_grad_()

    viz = Guided_Prop(model)

    result = viz.visualize(tensor)
    result = normalize(result)

    plt.imshow(result)
    plt.show()
由于是多任务问题,所以直接拿结果反传,对于一般的分类问题,可以给定target来用gt用one-hot反传。
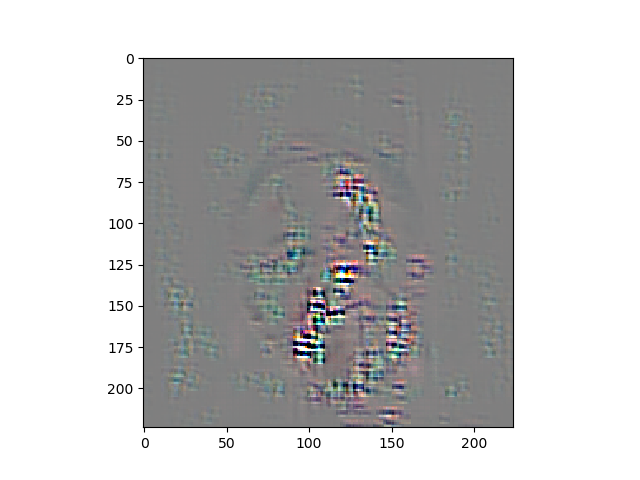
head pose estimation 的梯度可视化。