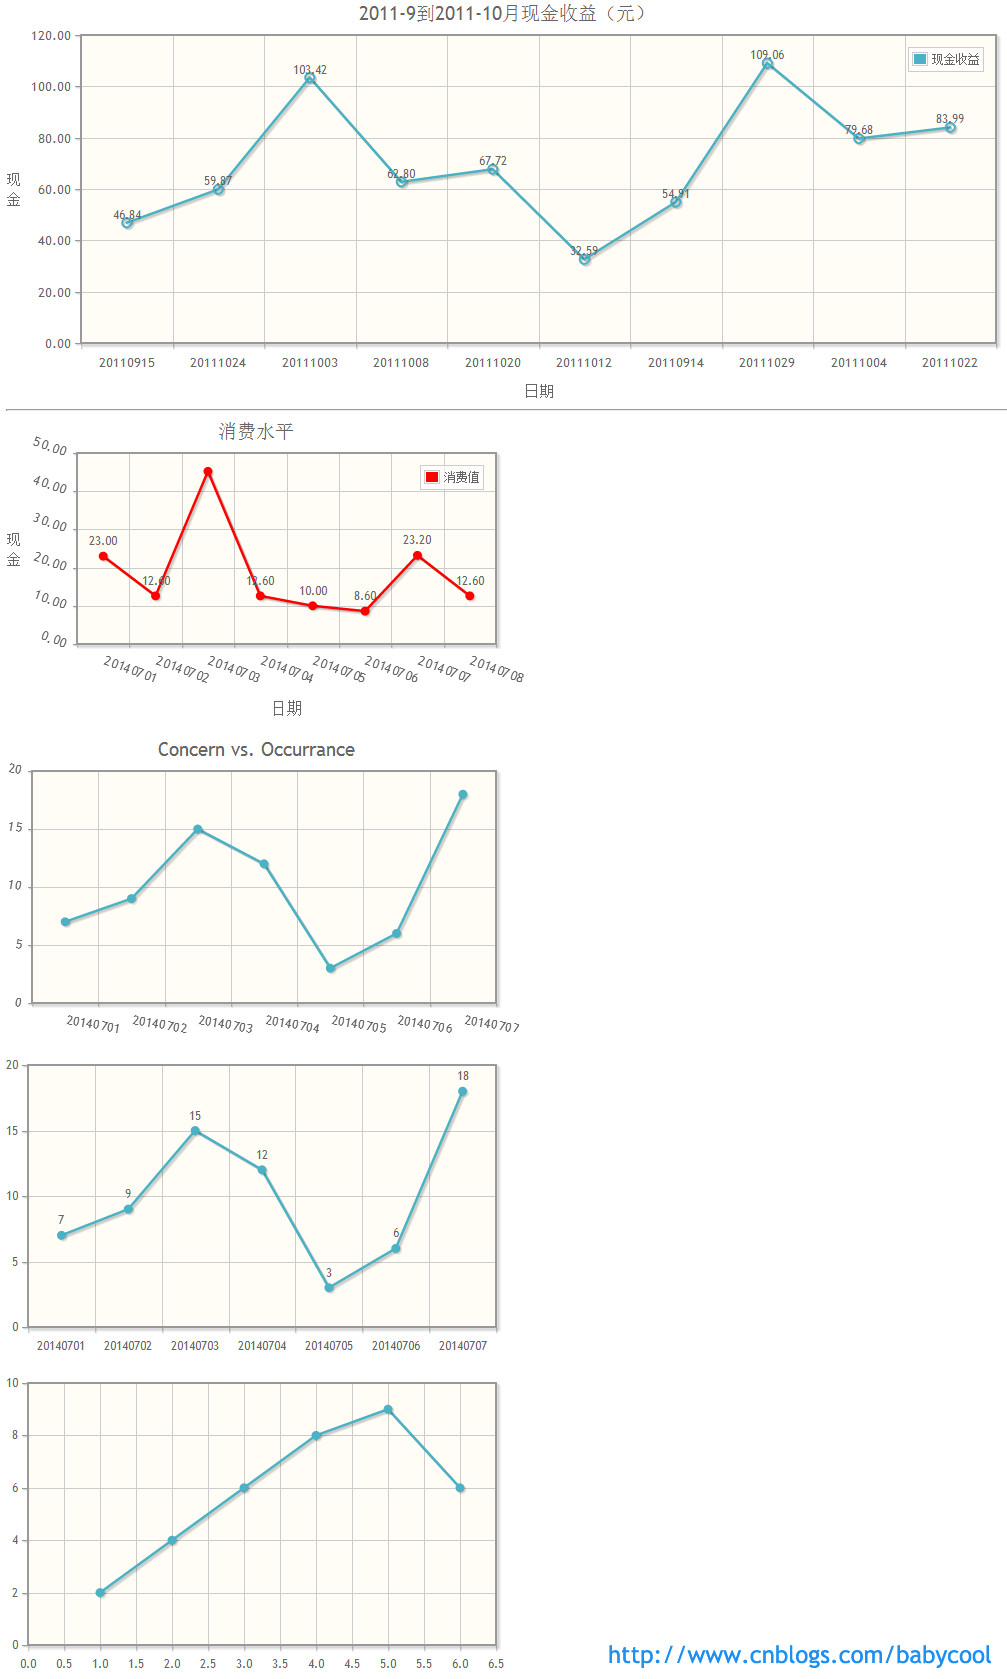
文章内容为初次使用Jqplot图表插件的测试代码,仅供参考。
<html xmlns="http://www.w3.org/1999/xhtml">
<head>
<meta http-equiv="Content-Type" content="text/html; charset=utf-8" />
<title></title>
<link href="js/jqplot/jquery.jqplot.min.css" rel="stylesheet" />
<script src="js/jqplot/jquery.min.js"></script>
<script src="js/jqplot/jquery.jqplot.min.js"></script>
<script src="js/jqplot/excanvas.min.js"></script>
<script src="js/jqplot/plugins/jqplot.barRenderer.min.js"></script>
<script src="js/jqplot/plugins/jqplot.pointLabels.min.js"></script>
<script src="js/jqplot/plugins/jqplot.canvasAxisTickRenderer.min.js"></script>
<script src="js/jqplot/plugins/jqplot.cursor.min.js"></script>
<script src="js/jqplot/plugins/jqplot.highlighter.min.js"></script>
<script src="js/jqplot/plugins/jqplot.dateAxisRenderer.min.js"></script>
<script src="js/jqplot/plugins/jqplot.canvasTextRenderer.min.js"></script>
<script src="js/jqplot/plugins/jqplot.categoryAxisRenderer.min.js"></script>
<script>
$(function () {
//--------------官网---------------------------
// var plot1 = $.jqplot('chart1', [[3, 7, 9, 1, 4, 6, 8, 2, 5]]);
//----------------实例 -------------------------
// var ticks = ['20110915', '20111024', '20111003', '20111008', '20111020', '20111012', '20110914', '20111029', '20111004', '20111022', '20111019', '20111017', '20111026', '20111005', '20110912', '20110903', '20110911', '20110923', '20111016', '20111001', '20110904', '20110924', '20110918', '20111021', '20111011', '20111030', '20110908', '20110913', '20110928', '20111025', '20110921', '20111002', '20111028', '20110906', '20110926', '20111018', '20110905', '20111007', '20111013', '20110907', '20110916', '20110927', '20111027', '20110902', '20110922', '20111006', '20111010', '20110910', '20111023', '20110919', '20110930', '20110917', '20110920', '20111009', '20111015', '20110909', '20110925', '20110929', '20111014', '22'];
var tick2 = ['20110915', '20111024', '20111003', '20111008', '20111020', '20111012', '20110914', '20111029', '20111004', '20111022'];
//var b1 = [46.84, 59.87, 103.42, 62.80, 67.72, 32.59, 54.91, 109.06, 79.68, 83.99, 56.27, 59.23, 68.53, 60.45, 78.47, 62.24, 91.62, 39.38, 52.76, 122.34, 95.84, 81.85, 72.62, 69.30, 49.76, 78.07, 36.22, 44.18, 88.87, 72.65, 49.90, 140.91, 75.52, 64.64, 63.31, 73.33, 65.53, 69.31, 56.26, 51.32, 50.53, 81.99, 74.16, 31.04, 41.95, 64.09, 65.85, 73.88, 91.34, 67.09, 93.91, 65.96, 52.86, 41.03, 67.93, 72.25, 74.18, 103.10, 51.57, 55.74]; //子统计1数据
var b2 = [46.84, 59.87, 103.42, 62.80, 67.72, 32.59, 54.91, 109.06, 79.68, 83.99];
var plot2 = $.jqplot('chart2', [b2], {
title: '2011-9到2011-10月现金收益(元)',
legend: { show: true, location: 'ne' }, //提示工具栏--show:是否显示,location: 显示位置 (e:东,w:西,s:南,n:北,nw:西北,ne:东北,sw:西南,se:东南)
series: [
{
label: '现金收益',
// lineWidth: 8, //线条粗细
markerOptions: { size: 9, style: "circle" } // 节点配置
}
], //提示工具栏
//captureRightClick: true,//禁用右键
seriesDefaults: {
pointLabels: { show: true, ypadding: -1 } //数据点标签
//renderer: $.jqplot.BarRenderer, //使用柱状图表示
//柱状体组之间间隔
//rendererOptions: {barMargin: 25}
},
axes: {
xaxis: {
label: "日期", //x轴显示标题
pad: 5,
renderer: $.jqplot.CategoryAxisRenderer, //x轴绘制方式
tickInterval: '1day',
ticks: tick2,
tickOptions: {
fontSize: '10pt'
},
mark: 'cross'
},
yaxis: {
label: "现金", // y轴显示标题
min: 0,
//tickInterval: 10, //网格线间隔大小
tickOptions: { formatString: '%.2f', fontSize: '10pt' }
}
}
});
//-----------------测试 折线图------------------------
var cosPoints = [
['20140701', 23],
['20140702', 12.6],
['20140703', 45.2],
['20140704', 12.6],
['20140705', 10],
['20140706', 8.6],
['20140707', 23.2],
['20140708', 12.6],
];
var plot3 = $.jqplot('chart1', [cosPoints], {
title: '消费水平', //标题
legend: { show: true, location: 'ne' }, //提示工具栏--show:是否显示,location: 显示位置 (e:东,w:西,s:南,n:北,nw:西北,ne:东北,sw:西南,se:东南)
//series: [{showMarker:true}],
axesDefaults: { //轴的刻度值,字体大小,字体类型,字体角度
tickRenderer: $.jqplot.CanvasAxisTickRenderer,
// labelRenderer: $.jqplot.CanvasAxisLabelRenderer,
tickOptions: {
//fontSize: '10pt',
angle: 20
}
},
seriesDefaults: {
label: '消费值', //分类名称
color: 'red', //分类在图标中表示(折现,柱状图等)的颜色
//showLine: true, //是否显示图表中的折线(折线图中的折线)
//markerOptions: {
// show:true
//}
showMarker: true, //是否显示节点
pointLabels: {
show: true,//数据点标签
// edgeTolerance:1
}
},
axes: {
xaxis: {
label: '日期',
renderer: $.jqplot.CategoryAxisRenderer,
// readerer:$.jqplot.DateAxisRenderer,
// tickInterval: 'lday',
labelOptions: {
//formatString:'%Y-%m-%d',
fontSize: '12pt'
}
},
yaxis: {
label: '现金',
//autoscale: true,
min: 0,
tickOptions: { formatString: '%.2f', fontSize: '10pt' }
}
}
});
//--------------------测试 提示文字的倾斜角度---------------------
var line3 = [['20140701', 7], ['20140702', 9], ['20140703', 15],
['20140704', 12], ['20140705', 3],
['20140706', 6], ['20140707', 18]];
var plot3 = $.jqplot('chart3', [line3], {
title: 'Concern vs. Occurrance',
// series: [{ renderer: $.jqplot.BarRenderer }],
axesDefaults: {
tickRenderer: $.jqplot.CanvasAxisTickRenderer,
tickOptions: {
angle: 10, //倾斜角度
fontSize: '10pt'
}
},
axes: {
xaxis: {
renderer: $.jqplot.CategoryAxisRenderer
}
}
});
//--------------------测试 节点高亮显示---------------------
var line4 = [['20140701', 7], ['20140702', 9], ['20140703', 15],
['20140704', 12], ['20140705', 3],
['20140706', 6], ['20140707', 18]];
var plot4 = $.jqplot('chart4', [line4], {
seriesDefaults: {
label: '消费值', //分类名称
pointLabels: {
show: true,//数据点标签
// edgeTolerance:1
}
},
axes: {
xaxis: {
renderer: $.jqplot.CategoryAxisRenderer,
tickOptions: {
//formatString: '%b %#d'
}
},
yaxis: {
tickOptions: {
// formatString: '$%.2f'
}
}
},
highlighter: {
show: true,
sizeAdjust: 5, // 当鼠标移动到数据点上时,数据点扩大的增量
fadeTooltip: true,// 设置提示信息栏出现和消失的方式(是否淡入淡出)
//lineWidthAdjust: 2.5, //当鼠标移动到放大的数据点上时,设置增大的数据点的宽度
tooltipOffset: 2, // 提示信息栏据被高亮显示的数据点的偏移位置,以像素计
//tooltipLocation: 'nw' // 提示信息显示位置(英文方向的首写字母): n, ne, e, se, s, sw, w, nw.
},
cursor: {
show: false,
showTooltip: true, // 是否显示提示信息栏
followMouse: true, //光标的提示信息栏是否随光标(鼠标)一起移动
//tooltipLocation: 'se', // 光标提示信息栏的位置设置。如果followMouse=true,那么该位置为
//提示信息栏相对于光标的位置。否则,为光标提示信息栏在图标中的位置
// 该属性可选值: n, ne, e, se, etc.
tooltipOffset: 6, //提示信息栏距鼠标(followMouse=true)或坐标轴(followMouse=false)的位置
}
});
//jquery jqPlot API 中文使用教程 - 沫鱼 - 博客园 http://www.cnblogs.com/mofish/archive/2011/08/15/2139728.html
//--------------------测试 Ajax数据调用(未深入测试)---------------------
var ajaxDataRenderer=function (url,plot,options) {
var ret=null;
$.ajax({
url:url,
async:false,//注意 一定要为false
dataType:"json",
success:function(data){
ret=data;
}
});
return ret;
};
//数据请求路径
var jsonurl = "DataHandler.ashx"; //返回数据: [[2,4,6,8,9,6]]
var plot5 = $.jqplot('chart5', jsonurl, {
dataRenderer: ajaxDataRenderer, //数据回调函数
dataRendererOptions: {
unusedOptionalUrl:jsonurl
}
});
})
</script>
</head>
<body>
<div id="chart2" style=" 1000px; height: 400px;"></div>
<hr />
<div id="chart1" style="height: 300px; 500px;"></div>
<br />
<div id="chart3" style="height: 300px; 500px;"></div>
<br />
<div id="chart4" style="height: 300px; 500px;"></div>
<br />
<div id="chart5" style="height: 300px; 500px;"></div>
</body>
<!--
JQUERY插件学习之jqPlot - bravezhe的专栏 - 博客频道 - CSDN.NET
http://blog.csdn.net/bravezhe/article/details/7666107
Jqplot应用&返回json在客户端构造数组 - - 博客频道 - CSDN.NET
http://blog.csdn.net/mousejoy/article/details/8078083
Examples | jqPlot
http://www.jqplot.com/tests/
jqplot使用小心得 - enggirl - 博客园
http://www.cnblogs.com/different/p/3683222.html
jqplot总结 - 草珊瑚 - 博客园
http://www.cnblogs.com/samwu/archive/2012/12/03/2799082.html
-->
</html>
相应的效果为:
转载请注明出处。