前言
Nagios的安装和配置以及批量添加监控服务器在我前面的文章中已经讲的很详细了。
我们知道,Nagios的网页控制页面(一般为http://nagio.domain.com/nagios)里可以显示监控的服务器、手动检测监控的服务、禁用报警通知等。当我们维护的时候一般都要先停掉报警,最简单的方式就是在网页里设置报警忽略。如下图所示,如监控memory后面紧跟的银色方框就代表disable notification for this service.

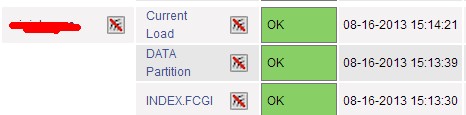
但是在维护完成之后很可能就忘记重新开启服务,会造成如下图所示情况,以至于真正出问题后报警没有发出。
status.dat文件结构
那么今天写的文章就是解决这个问题。方法是分析Nagios的status.dat文件。此文件位于/usr/local/nagios/var/status.dat,如果你的nagios是安装在/usr/local目录下的话。
我们来看看此文件的结构,使用vim打开后大致如下:
info {
        created=1376638115
        version=3.4.3
        last_update_check=0
        update_available=0
        last_version=
        new_version=
        }

programstatus {
        modified_host_attributes=0
        modified_service_attributes=0
        ......太多了省略
        }
hoststatus {
        host_name=csmu008
        modified_attributes=0
        check_command=check-host-alive
        check_period=24x7
        notification_period=24x7
        ......太多了省略
        notifications_enabled=1
        ......
        }
hoststatus {
        host_name=csmu009
        modified_attributes=0
        check_command=check-host-alive
        check_period=24x7
        notification_period=24x7
        ......太多了省略
        notifications_enabled=1
        ......
        }
servicestatus {
        host_name=csmu008
        service_description=TRAFFIC
        modified_attributes=0
        check_command=check_traffic!30!2!60M
        check_period=24x7
        notification_period=24x7
        .....太多了省略
        notifications_enabled=1
        .....
        }
servicestatus {
        host_name=csmu009
        service_description=TRAFFIC
        modified_attributes=0
        check_command=check_traffic!30!2!60M
        check_period=24x7
        notification_period=24x7
        .....太多了省略
        notifications_enabled=1
        .....
        }
contactstatus {
        contact_name=lenwood
        modified_attributes=0
        modified_host_attributes=0
        modified_service_attributes=0
        host_notification_period=24x7
        service_notification_period=24x7
        last_host_notification=0
        last_service_notification=1368757685
        host_notifications_enabled=1
        service_notifications_enabled=1
        }
大致分析下此文件的结构,通过上面贴出的部分内容,分为info、programstatus、hoststatus、servicestatus、contactstatus这几个模块,每个模块中是一些选项。仔细观察可以发现有主机名、监控命令、监控周期、通知是否禁用等选项。
这个文件是Nagios的server端进程不断更新的,所以我们可以通过分析此文件来知道监控的状态,从而得知哪些监控选项被禁用了。
通过shell脚本分析
Nagios生成的status.dat文件内容是多行,而且这种格式不利于awk等命令的分析,故我先将此文件转换成一行,然后再按照hoststatus和serverstatus分行。这是什么意思呢,先看脚本(exportlog.sh)。
#/bin/bash
#/infra/crontab/exportlog.sh
#written by Lenwood
#mail: ccyhaoran@live.cn

(/bin/cat /usr/local/nagios/var/status.dat|grep -v "#"|awk '{printf("%s",$1)}'|awk -F"servicestatus|hoststatus" '{i=2;while(i<=NF){print $i;i++}}'>/infra/other/nagios.log)
先将整个的文件转化成为一行,然后根据关键字截断分行,并写入到/infra/other/nagios.log中。
在最开始我截图的这个Nagios中监控的服务器有200台,监控项目有1000项左右,生成的satatus.dat文件有1.1M,不是很大,所以用脚本分析能够在很短的时间内完成。
执行结果大致如下
1 host_name=csmu008modified_attributes=0check_command=check-host-alivecheck_period=24x7notification_period=24x7check_interval=10.000000retry_interval=5.000000event_handler=has_been_checked=1should_be_scheduled=1check_execution_time=4.014check_latency=0.086check_type=0current_state=0last_hard_state=0last_event_id=10268current_event_id=10269current_problem_id=0last_problem_id=5141plugin_output=PINGlong_plugin_output=performance_data=rta=1.838000ms;300.000000;1000.000000;0.000000last_check=1376636225next_check=1376636835check_options=0current_attempt=1max_attempts=2state_type=1last_state_change=1374987423last_hard_state_change=1369900377last_time_up=1376636235last_time_down=1374987113last_time_unreachable=0last_notification=0next_notification=0no_more_notifications=0current_notification_number=0current_notification_id=0notifications_enabled=1problem_has_been_acknowledged=0acknowledgement_type=0active_checks_enabled=1passive_checks_enabled=1event_handler_enabled=1flap_detection_enabled=1failure_prediction_enabled=1process_performance_data=1obsess_over_host=1last_update=1376636455is_flapping=0percent_state_change=0.00scheduled_downtime_depth=0}

2 host_name=csmu009Smodified_attributes=0check_command=check-host-alivecheck_period=24x7notification_period=24x7check_interval=10.000000retry_interval=5.000000event_handler=has_been_checked=1should_be_scheduled=1check_execution_time=4.011check_latency=0.213check_type=0current_state=0last_hard_state=0last_event_id=0current_event_id=0current_problem_id=0last_problem_id=0plugin_output=PINGlong_plugin_output=performance_data=rta=0.141000ms;300.000000;1000.000000;0.000000last_check=1376635935next_check=1376636545check_options=0current_attempt=1max_attempts=2state_type=1last_state_change=1362990601last_hard_state_change=1362990601last_time_up=1376635945last_time_down=0last_time_unreachable=0last_notification=0next_notification=0no_more_notifications=0current_notification_number=0current_notification_id=0notifications_enabled=1problem_has_been_acknowledged=0acknowledgement_type=0active_checks_enabled=1passive_checks_enabled=1event_handler_enabled=1flap_detection_enabled=1failure_prediction_enabled=1process_performance_data=1obsess_over_host=1last_update=1376636455is_flapping=0percent_state_change=0.00scheduled_downtime_depth=0}

3 host_name=csmu010modified_attributes=0check_command=check-host-alivecheck_period=24x7notification_period=24x7check_interval=10.000000retry_interval=5.000000event_handler=has_been_checked=1should_be_scheduled=1check_execution_time=4.013check_latency=0.152check_type=0current_state=0last_hard_state=0last_event_id=9904current_event_id=9905current_problem_id=0last_problem_id=4955plugin_output=PINGlong_plugin_output=performance_data=rta=5.334000ms;300.000000;1000.000000;0.000000last_check=1376635955next_check=1376636565check_options=0current_attempt=1max_attempts=2state_type=1last_state_change=1373591472last_hard_state_change=1368786250last_time_up=1376635965last_time_down=1373591362last_time_unreachable=0last_notification=0next_notification=0no_more_notifications=0current_notification_number=0current_notification_id=0notifications_enabled=1problem_has_been_acknowledged=0acknowledgement_type=0active_checks_enabled=1passive_checks_enabled=1event_handler_enabled=1flap_detection_enabled=1failure_prediction_enabled=1process_performance_data=1obsess_over_host=1last_update=1376636455is_flapping=0percent_state_change=0.00scheduled_downtime_depth=0}

4 host_name=csmu011modified_attributes=0check_command=check-host-alivecheck_period=24x7notification_period=24x7check_interval=10.000000retry_interval=5.000000event_handler=has_been_checked=1should_be_scheduled=1check_execution_time=4.013check_latency=0.025check_type=0current_state=0last_hard_state=0last_event_id=0current_event_id=0current_problem_id=0last_problem_id=0plugin_output=PINGlong_plugin_output=performance_data=rta=0.406000ms;300.000000;1000.000000;0.000000last_check=1376635945next_check=1376636555check_options=0current_attempt=1max_attempts=2state_type=1last_state_change=1358348022last_hard_state_change=1358348022last_time_up=1376635955last_time_down=0last_time_unreachable=0last_notification=0next_notification=0no_more_notifications=0current_notification_number=0current_notification_id=0notifications_enabled=1problem_has_been_acknowledged=0acknowledgement_type=0active_checks_enabled=1passive_checks_enabled=1event_handler_enabled=1flap_detection_enabled=1failure_prediction_enabled=1process_performance_data=1obsess_over_host=1last_update=1376636455is_flapping=0percent_state_change=0.00scheduled_downtime_depth=0}
看上去很乱,但是其实就是将每个servicestatus里面的内容拿出来了,单独的写成一行,如上的四行就是csmu008、csmu009、csmu010、csmu011的servicesatus。
然后我们再分析nagios.log文件。脚本(filterhosts.sh)如下
#!/bin/bash
#/infra/crontab/filterhosts.sh
#written by Lenwood
#mail:ccyhaoran@live.cn

[ -f /infra/other/nagios.log ] || exit
while read i
do
    a=`echo $i|grep "notifications_enabled=0"|wc -l`
    if [ $a = 1 ];then
        (echo $i|awk -F"modified_attributes" '{print $1}')
    fi

done < /infra/other/nagios.log
逐行读取nagios.log文件,判断是否有出现notification_enabled=0,有的话说明这个service被禁用报警通知了,这样我们就可以发送邮件提醒自己。
发送邮件脚本(sendhosts.sh)如下
#!/bin/bash
a=`/infra/crontab/filterhosts.sh|wc -l`
if [ "$a" -ne 0 ];then
    (/infra/crontab/filterhosts.sh|uniq|mail -s "hosts not enable_notification on $HOSTNAME nagios" ccyhaoran@live.cn)
fi
我们将他们写入crontab,每天提醒两次。crontab如下
1  0-23/5 * * * root /infra/crontab/exportlog.sh >/dev/null 2>&1
25 0-23/12 * * * root /infra/crontab/sendhosts.sh >/dev/null 2>&1
这样就实现了Nagios监控状态的智能提醒,来看看结果吧。

如上所示,csmu008上的对于csmd003和csmd004的load监控的报警被禁用了,赶紧登陆Nagios网页控制页面恢复吧。