zoukankan      html  css  js  c++  java
  • kendoui仪表板和直方图 演示样本

    到那个时刻kendeodui我相信大家一定不陌生。该js在绘画方面的好成绩。
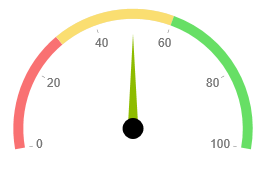
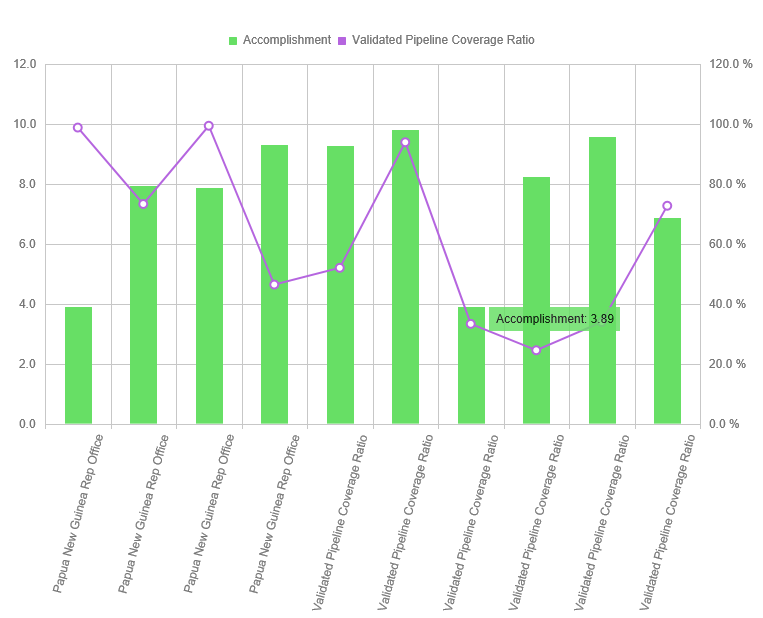
    现在来看看 它的仪表盘和直方图效果:

    html和js代码例如以下:

    <!DOCTYPE html>
    <html xmlns="http://www.w3.org/1999/xhtml">
    <head>
        <title>kendoui DEmo</title>
        <link type="text/css" rel="stylesheet" href="kendoui/styles/kendo.common.min.css" />
        <link type="text/css" rel="stylesheet" href="kendoui/styles/kendo.dataviz.metro.min.css" />
    
        <script type="text/javascript" src="kendoui/js/jquery.min.js"></script>
        <script type="text/javascript" src="kendoui/js/kendo.all.min.js"></script>
    
    </head>
    <body>
        <div>
    
            <div class="js-gauge" style=" 250px; height:200px"></div>
            <div class="js-chart" style=" 750px; height:600px"></div>
        </div>
        <script type="text/javascript">
            var ranges = [{
                from: 0,
                to: 30,
                color: "#F97172"
            }, {
                from: 30,
                to: 60,
                color: "#FADE71"
            }, {
                from: 60,
                to: 100,
                color: "#67DF65"
            }];


            $(".js-gauge").kendoRadialGauge({
                theme: 'metro',
                pointer: {
                    value: 50,
                    cap: {
                        size: 0.1,
                        color: "black"
                    }
                },
                scale: {
                    minorUnit: 20,
                    majorTicks: {
                        size: 3
                    },
                    startAngle: -10,
                    endAngle: 190,
                    max: 100,
                    labels: {
                        visible: true,
                        position: "inside",
                    },
                    rangeSize: 10,
                    ranges: ranges
                }
            });
    
            $(".js-chart").kendoChart({
                theme: 'metro',
                legend: {
                    position: "top"
                },
                seriesDefaults: {
                    type: "column"
                },
                series: [{
                    name: "Accomplishment",
                    color: "#67DF65",
                    axis: "number",
                    data: [3.907, 7.943, 7.848, 9.284, 9.263, 9.801, 3.890, 8.238, 9.552, 6.855],
                    tooltip: {
                        visible: true,
                        format: "{0:p1}",
                        template: "#= series.name #: #= kendo.toString(value,'n2') #"
                    }
                }, {
                    type: "line",
                    color: "#B565DF",
                    axis: "percent",
                    name: "Validated Pipeline Coverage Ratio",
                    data: [0.988, 0.733, 0.994, 0.464, 0.52, 0.939, 0.333, 0.245, 0.339, 0.727],
                    tooltip: {
                        visible: true,
                        format: "{0:p1}",
                        template: "#= series.name #: #= kendo.toString(value,'p2') #"
                    }
                }],
                valueAxis: [{
                    name: 'number',
                    labels: {
                        format: "{0:n1}"
                    },
                    line: {
                        visible: false
                    }
                }, {
                    name: 'percent',
                    labels: {
                        format: "{0:p1}"
                    },
                    line: {
                        visible: false
                    }
                }],
                categoryAxis: {
                    categories: ['Papua New Guinea Rep Office', 'Papua New Guinea Rep Office', 'Papua New Guinea Rep Office', 'Papua New Guinea Rep Office', 'Validated Pipeline Coverage Ratio', 'Validated Pipeline Coverage Ratio', 'Validated Pipeline Coverage Ratio', 'Validated Pipeline Coverage Ratio', 'Validated Pipeline Coverage Ratio', 'Validated Pipeline Coverage Ratio'],
                    line: {
                        visible: true
                    },
                    labels: {
                        rotation: -75
                    },
                    axisCrossingValues: [0, 10]
                },
                tooltip: {
                }
            });
        </script>
    </body>
    </html>


    相关代码下载相关代码下载http://download.csdn.net/detail/dz45693/7647501

    版权声明:本文博客原创文章,博客,未经同意,不得转载。

  • 相关阅读:
    Windows Server 2012 R2 里面如何安装Net Framework 3.5
    虚拟机网络驱动(共享文件夹)不见了的解决方案-适用于win7~win10 and Windows Server 2008~Windows Server 2012R2
    在计算机 . 上没有找到服务 WAS
    免费获取WP之类的开发者权限或免费使用Azure 2015-10-19
    颠覆你的认知,带你领略史上最为齐全的微软黑科技之旅
    【技巧】只利用 Visual Stdio 自带的工具这么找父类?
    网站定位之---根据IP获得区域
    06.移动先行之谁主沉浮----我的代码我来写(Xaml的优势)
    05.移动先行之谁主沉浮----小应用的美化
    04.移动先行之谁主沉浮----XAML的探索
  • 原文地址:https://www.cnblogs.com/bhlsheji/p/4671505.html
Copyright © 2011-2022 走看看