zabbix监控tcp
Tcp的连接状态对于我们web服务器来说是至关重要的,尤其是并发量ESTAB;或者是syn_recv值,假如这个值比较大的话我们可以认为是不是受到了攻击,或是是time_wait值比较高的话,我们要考虑看我们内核是否需要调优,太高的time_wait值的话会占用太多端口,要是端口少的话后果不堪设想:所以今天我们来学学如何使用Zabbix监控tcp状态
1.编写shell脚本
cd /server/scripts/
vim tcp_status.sh
#!/bin/sh
[ $# -ne 1 ] && echo "Usage:CLOSE-WAIT|CLOSED|CLOSING|ESTAB|FIN-WAIT-1|FIN-WAIT-2|LAST-ACK|LISTEN|SYN-RECV SYN-SENT|TIME-WAIT" && exit 1
tcp_status_fun(){
TCP_STAT=$1
ss -ant | awk 'NR>1 {++s[$1]} END {for(k in s) print k,s[k]}' > /tmp/ss.txt
TCP_STAT_VALUE=$(grep "$TCP_STAT" /tmp/ss.txt | cut -d ' ' -f2)
if [ -z "$TCP_STAT_VALUE" ];then
TCP_STAT_VALUE=0
fi
echo $TCP_STAT_VALUE
}
tcp_status_fun $1;
添加执行权限
chmod +x tcp_status.sh
2.监控项tcp_status.conf的配置文件如下
UserParameter=tcp_status[*],/bin/bash /server/scripts/tcp_status.sh "$1"
3.重启zabbix-agent 修改配置文件必须重启
systemctl restart zabbix-agent
4.Server测试Agent是否能获取到值,通过Zabbix_get(不要直接执行脚本)
[root@zabbix-server ~]# zabbix_get -s 10.0.0.7 -k tcp_status[ESTAB]
2
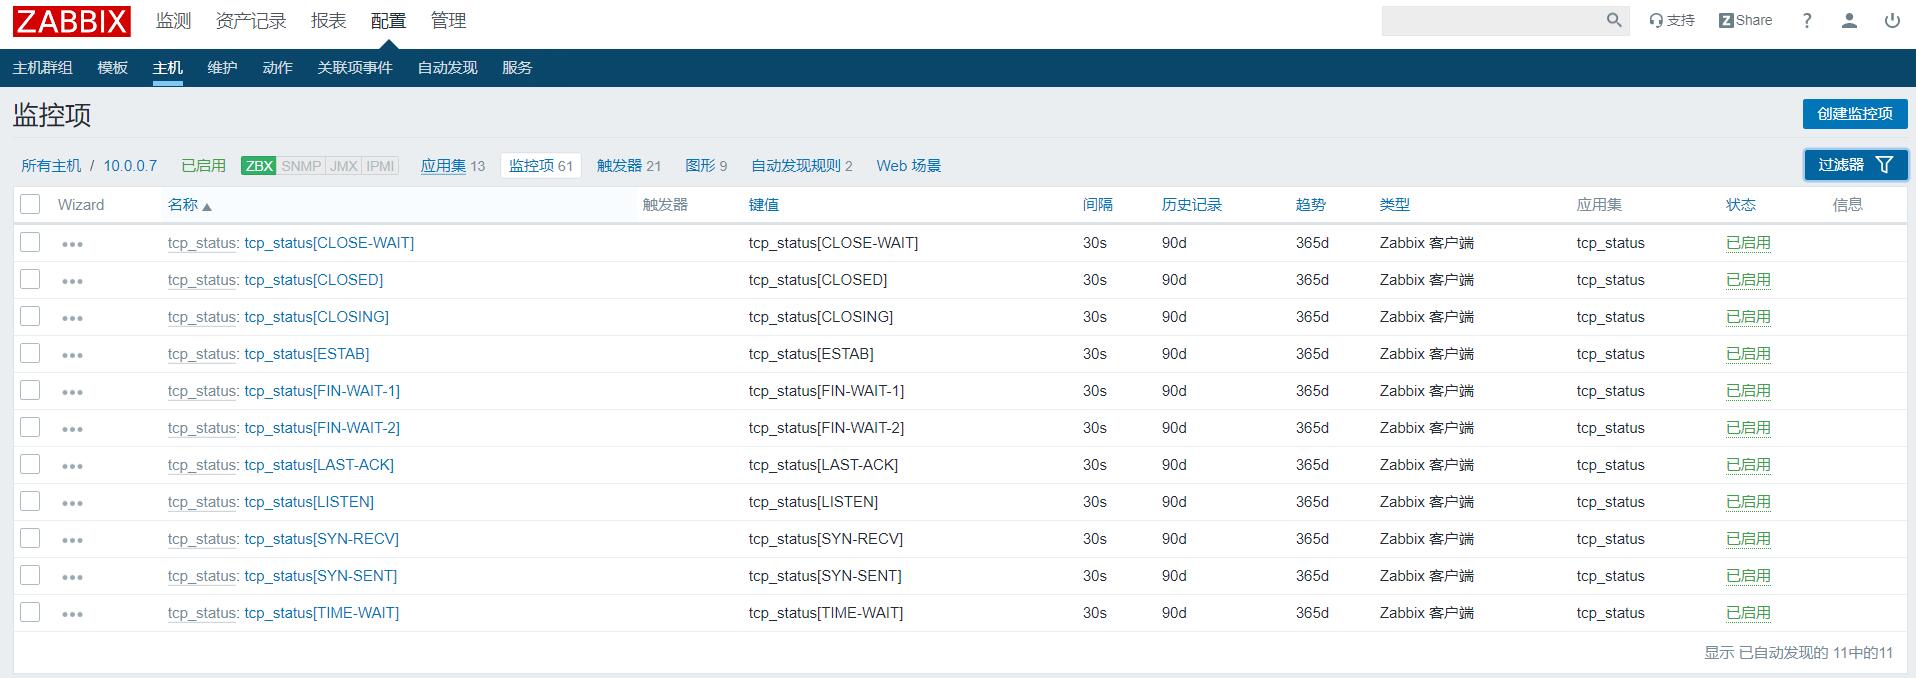
5.5.添加所有监控项(记得将模板关联主机)
zabbix监控nginx
1.开启监控项
在nginx配置文件的Server标签下添加如下内容
    location /nginx_status {
            stub_status on;   #开启状态页面
            access_log  off;  #访问日志关闭
            allow 127.0.0.1;
            allow 10.0.0.1;  #允许
            deny all;  #拒绝所有
        }
2.本地访问Nginx Status
[root@web01 ~]# curl http://127.0.0.1/nginx_status
Active connections: 1
server accepts handled requests
 1 1 1
Reading: 0 Writing: 1 Waiting: 0
Nginx状态解释:
Active connections  Nginx正处理的活动链接数1个
server              Nginx启动到现在共处理了1个连接。
accepts             Nginx启动到现在共成功创建1次握手。
handled requests    Nginx总共处理了1次请求。
Reading             Nginx读取到客户端的 Header 信息数。
Writing             Nginx返回给客户端的 Header 信息数。
Waiting             Nginx已经处理完正在等候下一次请求指令的驻留链接,开启。

Keep-alive的情况下,这个值等于active-(reading + writing)。
请求丢失数=(握手数-连接数)可以看出,本次状态显示没有丢失请求
3.编写Nginx的Shell脚本(如果端口不一致,只需要修改脚本端口即可)
vim nginx_status.sh
#!/bin/bash


NGINX_PORT=80  #如果端口不同仅需要修改脚本即可,否则修改xml很麻烦
NGINX_COMMAND=$1


nginx_active(){
    /usr/bin/curl -s "http://127.0.0.1:"$NGINX_PORT"/nginx_status/" |awk '/Active/ {print $NF}'
}

nginx_reading(){
    /usr/bin/curl -s "http://127.0.0.1:"$NGINX_PORT"/nginx_status/" |awk '/Reading/ {print $2}'
}

nginx_writing(){
    /usr/bin/curl -s "http://127.0.0.1:"$NGINX_PORT"/nginx_status/" |awk '/Writing/ {print $4}'
       }

nginx_waiting(){
    /usr/bin/curl -s "http://127.0.0.1:"$NGINX_PORT"/nginx_status/" |awk '/Waiting/ {print $6}'
       }

nginx_accepts(){
    /usr/bin/curl -s "http://127.0.0.1:"$NGINX_PORT"/nginx_status/" |awk 'NR==3 {print $1}'
       }

nginx_handled(){
    /usr/bin/curl -s "http://127.0.0.1:"$NGINX_PORT"/nginx_status/" |awk 'NR==3 {print $2}'
       }

nginx_requests(){
    /usr/bin/curl -s "http://127.0.0.1:"$NGINX_PORT"/nginx_status/" |awk 'NR==3 {print $3}'
       }


  case $NGINX_COMMAND in
    active)
        nginx_active;
        ;;
    reading)
        nginx_reading;
        ;;
    writing)
        nginx_writing;
        ;;
    waiting)
        nginx_waiting;
        ;;
    accepts)
        nginx_accepts;
        ;;
    handled)
        nginx_handled;
        ;;
    requests)
        nginx_requests;
        ;;
          *)
        echo $"USAGE:$0 {active|reading|writing|waiting|accepts|handled|requests}"
    esac
4.给脚本添加执行权限
[root@web01 scripts]# chmod +x nginx_status.sh
[root@web01 scripts]# ll
总用量 8
-rwxr-xr-x 1 root root 1416 10月  5 15:32 nginx_status.sh
5.监控项nginx_status.conf的配置文件如下
[root@web01 zabbix_agentd.d]# cat nginx_status.conf
UserParameter=nginx_status[*],/bin/bash /server/scripts/nginx_status.sh "$1"
6.重启zabbix-agent服务
[root@web01 zabbix_agentd.d]# systemctl restart zabbix-agent.service
7.使用Zabbix_get来获取值
[root@zabbix-server ~]# zabbix_get -s 10.0.0.7 -k nginx_status[writing]
1
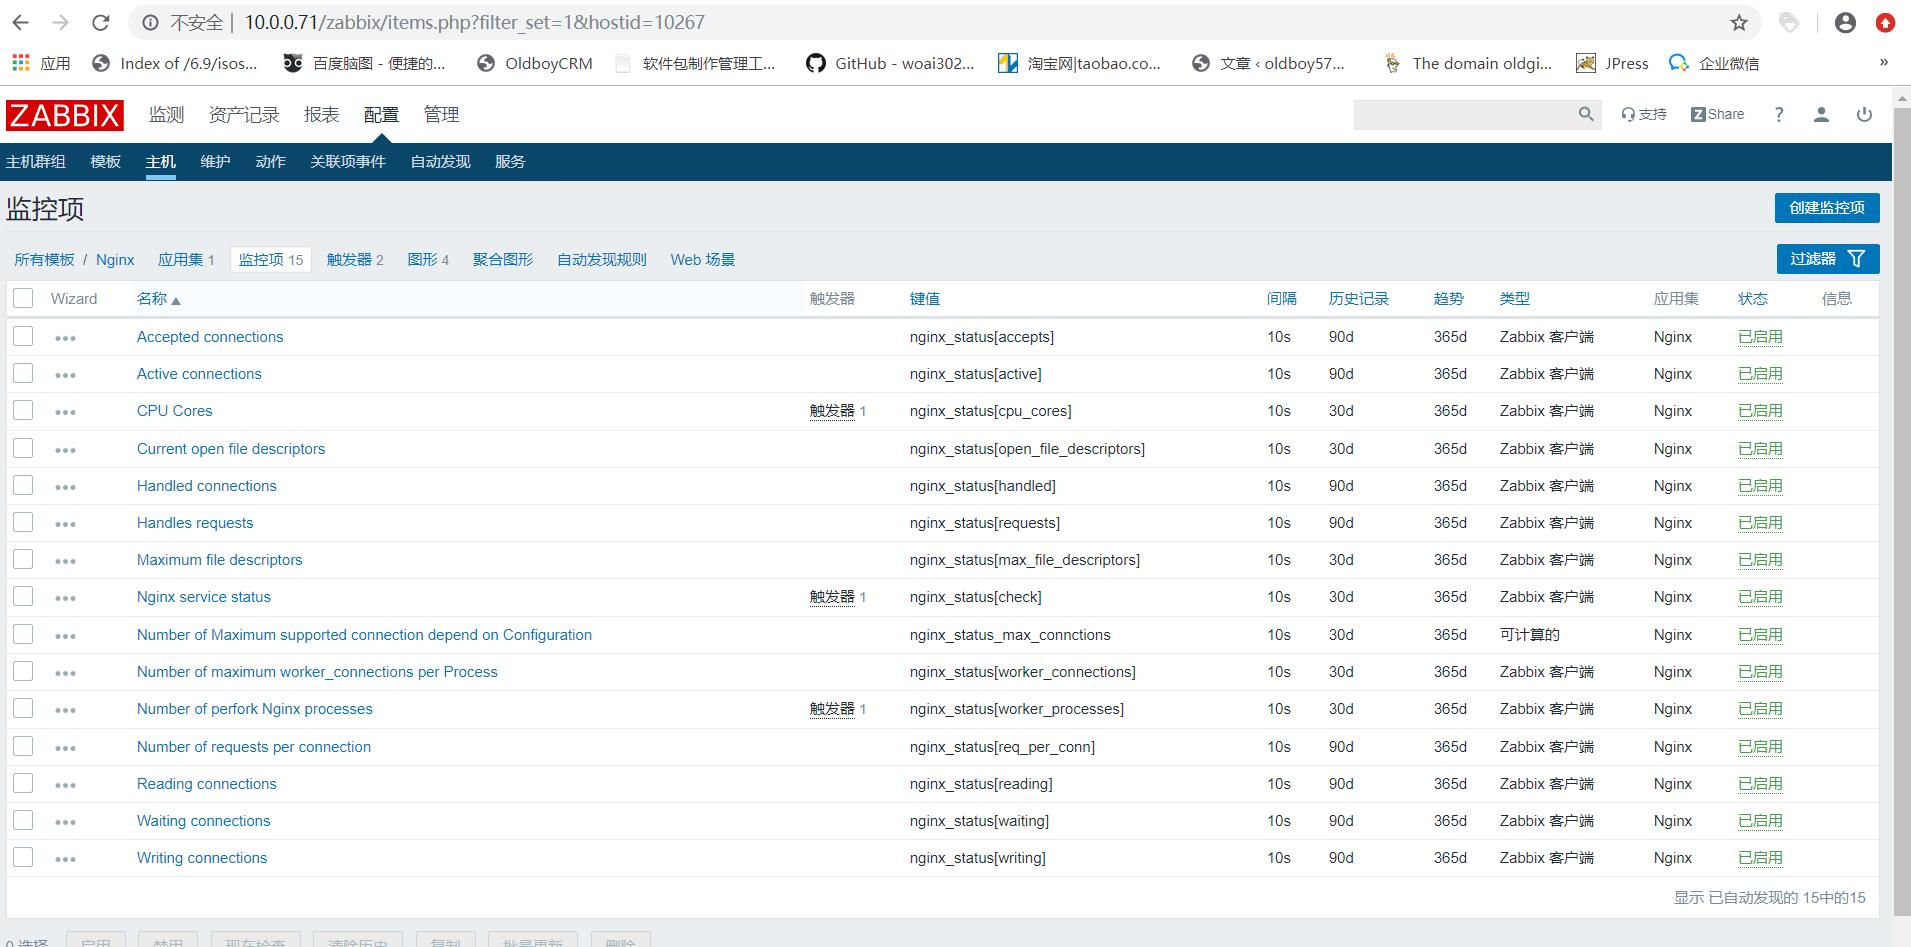
8.添加所有监控项, 记得关联到指定的主机
Zabbix监控php-fpm
1.开启PHP监控页
vim /etc/php-fpm.d/www.conf
pm.status_path = /phpfpm_status
systemctl restart php-fpm  #重启服务
2.修改nginx的配置文件,增加如下location访问PHP-FPM状态信息
location /phpfpm_status {
            fastcgi_pass   127.0.0.1:9000;
            fastcgi_index  index.php;
            fastcgi_param  SCRIPT_FILENAME  $document_root$fastcgi_script_name;
            include        fastcgi_params;
    }
3.访问测试phpfpm_status
[root@web01 ~]# curl http://127.0.0.1/phpfpm_status
pool:                 www
process manager:      dynamic
start time:           05/Oct/2019:20:37:07 +0800
start since:          48
accepted conn:        1
listen queue:         0
max listen queue:     0
listen queue len:     511
idle processes:       4
active processes:     1
total processes:      5
max active processes: 1
max children reached: 0
slow requests:        0


#PHP-FPM状态解释:
pool #fpm池名称,大多数为www
process manager #进程管理方式dynamic或者static
start time #启动日志,如果reload了fpm,时间会更新
start since #运行时间
accepted conn #当前池接受的请求数
listen queue #请求等待队列,如果这个值不为0,那么需要增加FPM的进程数量
max listen queue #请求等待队列最高的数量
listen queue len #socket等待队列长度
idle processes #空闲进程数量
active processes #活跃进程数量
total processes #总进程数量
max active processes #最大的活跃进程数量(FPM启动开始计算)
max children reached #程最大数量限制的次数,如果这个数量不为0,那说明你的最大进程数量过小,可以适当调整。
4.编写php-fpm的Shell脚本(如果端口不一致,只需要修改脚本端口即可)
vim phpfpm_status.sh


#!/bin/bash

PHPFPM_COMMAND=$1
PHPFPM_PORT=80  #根据监听不同端口进行调整

start_since(){
    /usr/bin/curl -s "http://127.0.0.1:"$PHPFPM_PORT"/phpfpm_status" |awk '/^start since:/ {print $NF}'
}

accepted_conn(){
    /usr/bin/curl -s "http://127.0.0.1:"$PHPFPM_PORT"/phpfpm_status" |awk '/^accepted conn:/ {print $NF}'
}

listen_queue(){
    /usr/bin/curl -s "http://127.0.0.1:"$PHPFPM_PORT"/phpfpm_status" |awk '/^listen queue:/ {print $NF}'
}

max_listen_queue(){
    /usr/bin/curl -s "http://127.0.0.1:"$PHPFPM_PORT"/phpfpm_status" |awk '/^max listen queue:/ {print $NF}'
}

listen_queue_len(){
    /usr/bin/curl -s "http://127.0.0.1:"$PHPFPM_PORT"/phpfpm_status" |awk '/^listen queue len:/ {print $NF}'
}

idle_processes(){
    /usr/bin/curl -s "http://127.0.0.1:"$PHPFPM_PORT"/phpfpm_status" |awk '/^idle processes:/ {print $NF}'
}

active_processes(){
    /usr/bin/curl -s "http://127.0.0.1:"$PHPFPM_PORT"/phpfpm_status" |awk '/^active processes:/ {print $NF}'
}

total_processes(){
    /usr/bin/curl -s "http://127.0.0.1:"$PHPFPM_PORT"/phpfpm_status" |awk '/^total processes:/ {print $NF}'
}

max_active_processes(){
    /usr/bin/curl -s "http://127.0.0.1:"$PHPFPM_PORT"/phpfpm_status" |awk '/^max active processes:/ {print $NF}'
}

max_children_reached(){
    /usr/bin/curl -s "http://127.0.0.1:"$PHPFPM_PORT"/phpfpm_status" |awk '/^max children reached:/ {print $NF}'
}

slow_requests(){
    /usr/bin/curl -s "http://127.0.0.1:"$PHPFPM_PORT"/phpfpm_status" |awk '/^slow requests:/ {print $NF}'
}

case $PHPFPM_COMMAND in
    start_since)
        start_since;
        ;;
    accepted_conn)
        accepted_conn;
        ;;
    listen_queue)
        listen_queue;
        ;;
    max_listen_queue)
        max_listen_queue;
        ;;
    listen_queue_len)
        listen_queue_len;
        ;;
    idle_processes)
        idle_processes;
        ;;
    active_processes)
        active_processes;
        ;;
        total_processes)
                total_processes;
                ;;
        max_active_processes)
                max_active_processes;
                ;;
        max_children_reached)
                max_children_reached;
                ;;
        slow_requests)
                slow_requests;
                ;;
          *)
        echo $"USAGE:$0 {start_since|accepted_conn|listen_queue|max_listen_queue|listen_queue_len|idle_processes|active_processes|total_processes|max_active_processes|max_children_reached}"
    esac
5.给脚本添加执行权限
chmod +x phpfpm_status.sh
[root@web01 scripts]# ll
总用量 4
-rwxr-xr-x 1 root root 2463 10月  5 20:45 phpfpm_status.sh
6.监控项的phpfpm_status.conf配置文件如下:
[root@web01 zabbix_agentd.d]# cat phpfpm_status.conf
UserParameter=phpfpm_status[*],/bin/bash /etc/zabbix/scripts/phpfpm_status.sh "$1"
7.重启zabbix-agent
systemctl restart zabbix-agent
8.zabbix_get命令来获取Agent端的值
[root@zabbix-server ~]# zabbix_get -s 10.0.0.7 -k phpfpm_status[accepted_conn]
2
9.添加所有监控项, 最后记得关联至对应主机