pillow是个很好用的python图像处理库,可以到官方网站下载最新的文件。如果官网的任何PIL版本都不能与自己的python版本对应,或安装成功后发现运行出错,可以尝试从一个非官方的whl网站下载:http://www.lfd.uci.edu/~gohlke/pythonlibs/#scipy 这个网站的内容相当丰富,而且版本齐全。
打开图片
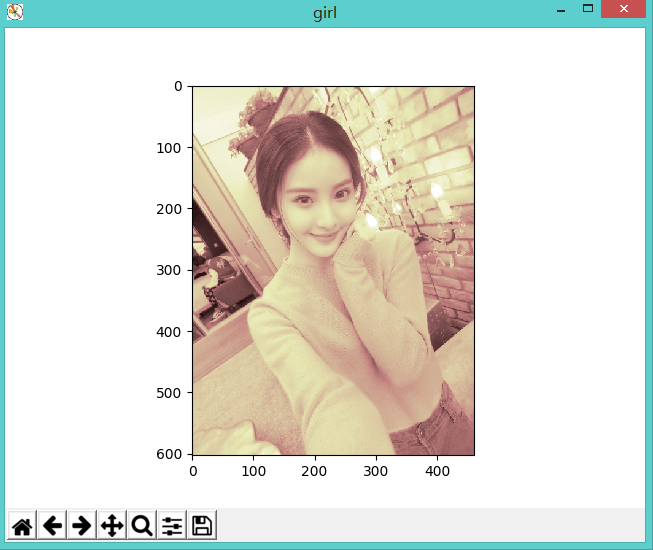
from PIL import Image
import matplotlib.pyplot as plt

img = Image.open('girl.png')
img.show()

控制台显示:size=(461, 603), mode=RGBA, format=PNG
代码很简单,但PIL使用操作系统的默认方式打开图片,我们需要用一些更牛叉的方式打开:
1 from PIL import Image
2 import matplotlib.pyplot as plt
3
4 img = Image.open('girl0.png')
5 model = img.convert('L')
6 plt.figure("girl")
7 #the argument comp is Colormap
8 plt.imshow(model, cmap='pink')
9 plt.show()
其中img.convert指定一种色彩模式:
- 1 (1-bit pixels, black and white, stored with one pixel per byte)
- L (8-bit pixels, black and white)
- P (8-bit pixels, mapped to any other mode using a colour palette)
- RGB (3x8-bit pixels, true colour)
- RGBA (4x8-bit pixels, true colour with transparency mask)
- CMYK (4x8-bit pixels, colour separation)
- YCbCr (3x8-bit pixels, colour video format)
- I (32-bit signed integer pixels)
- F (32-bit floating point pixels)
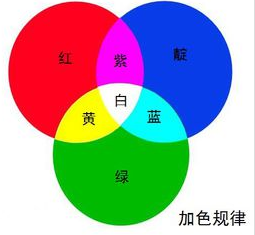
分离rgba
rgb指红绿蓝光色三原色,a指alpha通道,一般用作不透明度参数
img = Image.open('girl0.png')
# 分离rgba
r, g, b, a = img.split()
plt.figure("girl0")
plt.imshow(r)
plt.show()
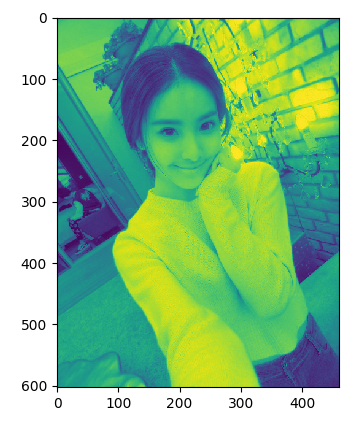
需要注意的是,并非所有图片都有alpha通道,此时 img.split()仅能返回r,g,b
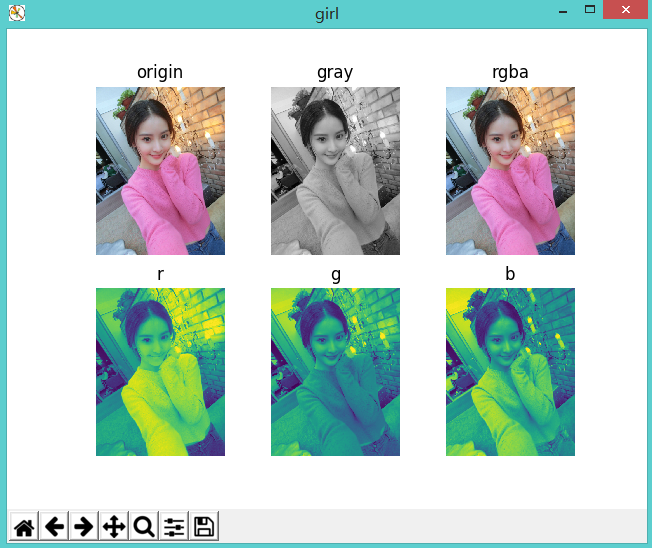
显示多个图片
from PIL import Image
import matplotlib.pyplot as plt

img = Image.open('girl0.png')
gray = img.convert('L')
# 分离rgba
r, g, b, a = img.split()
plt.figure("girl")

def setPlot(num, title):
    #subplot(nrows, ncols, plot_number)
    #图表的整个绘图区域被等分为numRows行和numCols列,然后按照从左到右、从上到下的顺序对每个区域进行编号,左上区域的编号为1
    plt.subplot(2, 3, num)
    plt.title(title)
    plt.axis('off')

setPlot(1, 'origin')
plt.imshow(img)

setPlot(2, 'gray')
plt.imshow(gray, cmap='gray')

setPlot(3, 'rgba')
# 合并rgba
plt.imshow(Image.merge('RGBA', (r, g, b, a)))

setPlot(4, 'r')
plt.imshow(r)

setPlot(5, 'g')
plt.imshow(g)

setPlot(6, 'b')
plt.imshow(b)
二值化处理
到了关键时刻
from PIL import Image
import matplotlib.pyplot as plt

#二值化处理
img = Image.open('girl0.png')
gray = img.convert('L')

WHITE, BLACK = 1, 0
img_new = gray.point(lambda x: WHITE if x > 128 else BLACK)
plt.imshow(img_new, cmap='gray')
plt.show()
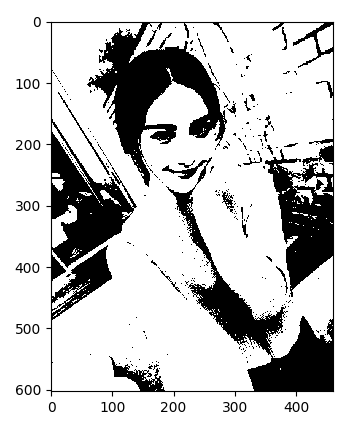
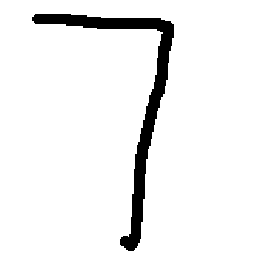
图片由像素组成,每个像素对应着rgb值,整个图片可以看成一个矩阵。我们将大于128的像素点转换为1,其它转换为0。如果有一张背景色是彩色的手写文字,经过二值化处理后得到这样的图片:
图片压缩
如果图片大小不一,不利于下一步工作,在此需要将图片压缩成统一大小,对于手写数字,可将其压缩为32*32
 1 #等比例压缩图片
 2 #参考 http://fc-lamp.blog.163.com/blog/static/174566687201282424018946/
 3 def resizeImg(**args):
 4     #dst_w,dst_h  目标图片大小,  save_q  图片质量
 5     args_key = {'ori_img':'', 'dst_img':'', 'dst_w':'', 'dst_h':'', 'save_q':75}
 6     arg = {}
 7     for key in args_key:
 8         if key in args:
 9             arg[key] = args[key]
10
11     im = Image.open(arg['ori_img'])
12     ori_w, ori_h = im.size
13     widthRatio = heightRatio = None
14     ratio = 1
15     if (ori_w and ori_w > arg['dst_w']) or (ori_h and ori_h > arg['dst_h']):
16         if arg['dst_w'] and ori_w > arg['dst_w']:
17             widthRatio = float(arg['dst_w']) / ori_w
18         if arg['dst_h'] and ori_h > arg['dst_h']:
19             heightRatio = float(arg['dst_h']) / ori_h
20
21         if widthRatio and heightRatio:
22             if widthRatio < heightRatio:
23                 ratio = widthRatio
24             else:
25                 ratio = heightRatio
26
27         if widthRatio and not heightRatio:
28             ratio = widthRatio
29         if heightRatio and not widthRatio:
30             ratio = heightRatio
31
32         newWidth = int(ori_w * ratio)
33         newHeight = int(ori_h * ratio)
34     else:
35         newWidth = ori_w
36         newHeight = ori_h
37
38     im.resize((newWidth, newHeight), Image.ANTIALIAS).save(arg['dst_img'], quality=arg['save_q'])
可以将二值化处理后的图片打印出来
 1 resizeImg(ori_img='7.jpg', dst_img='7_1.jpg', dst_w=32, dst_h=32, save_q=60)
 2
 3 #二值化处理
 4 img = Image.open('7_1.jpg')
 5 gray = img.convert('L')
 6
 7 WHITE, BLACK = 1, 0
 8 img_new = gray.point(lambda x: WHITE if x > 128 else BLACK)
 9 arr = nmp.array(img_new)
10
11 for i in range(arr.shape[0]):
12     print(arr[i].flatten())
于是手写数字变成了这样:
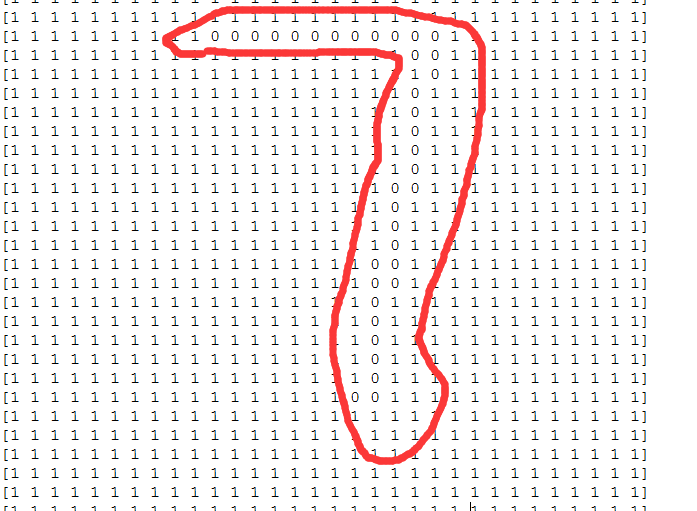
这就好玩了。其基本思路是将多维特征转换为容易识别的二维特征,使用KNN或神经网络等方法进行学习,从而使计算机识别出正确的数字。后续文章将会介绍如何设别。
出处:微信公众号 "我是8位的"
本文以学习、研究和分享为主,如需转载,请联系本人,标明作者和出处,非商业用途!
扫描二维码关注作者公众号“我是8位的”
