二项分布式
import numpy as np
import matplotlib.pyplot as plt
list = np.random.binomial(n=10, p=0.5,size = 10000)
plt.hist(list, bins = 8,color = 'g', alpha = 0.4,edgecolor = 'b')
plt.show()
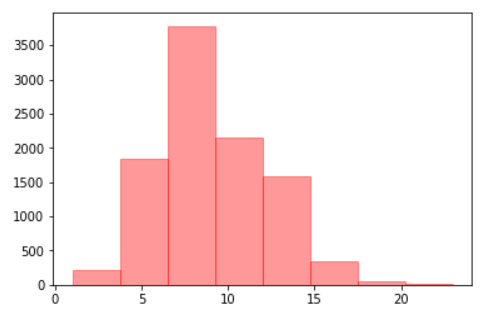
泊松分布式
import numpy as np
import matplotlib.pyplot as plt
list = np.random.poisson(9,10000)
plt.hist(list, bins = 8, color = 'r', alpha = 0.4, edgecolor = 'r')
plt.show()
均匀分布
list = np.random.uniform(0,10,10000)
plt.hist(list,bins = 7,color = 'g', alpha = 0.4, edgecolor  = 'b')
plt.show()

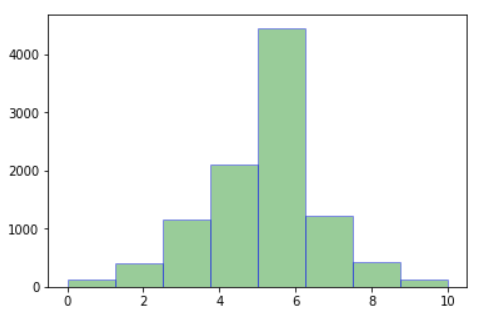
正态分布
list = np.random.normal(0,1,10000)
plt.hist(list, bins = 8, color = 'r', alpha = 0.5, edgecolor = 'r')
plt.show()

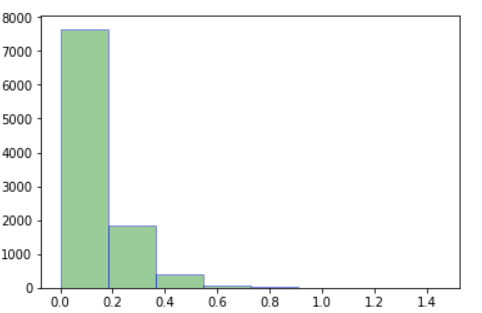
指数分布
list = np.random.exponential(0.125, 10000)
plt.hist(list, bins=8,color = 'g', alpha = 0.4, edgecolor = 'b')
plt.show()