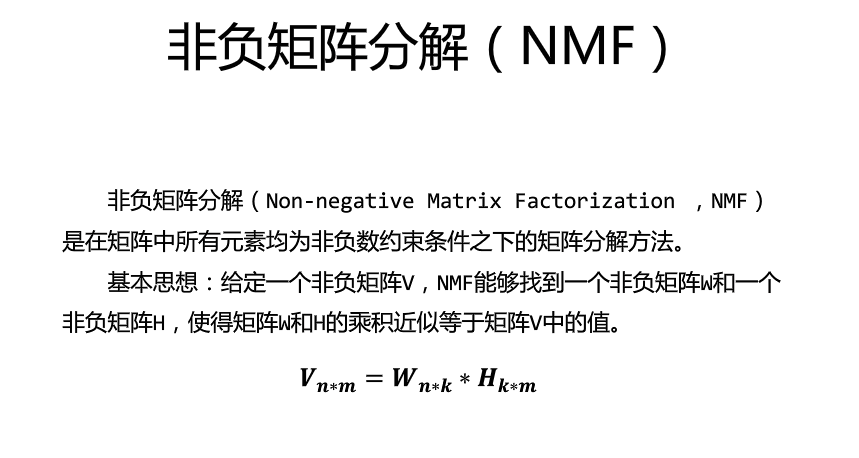
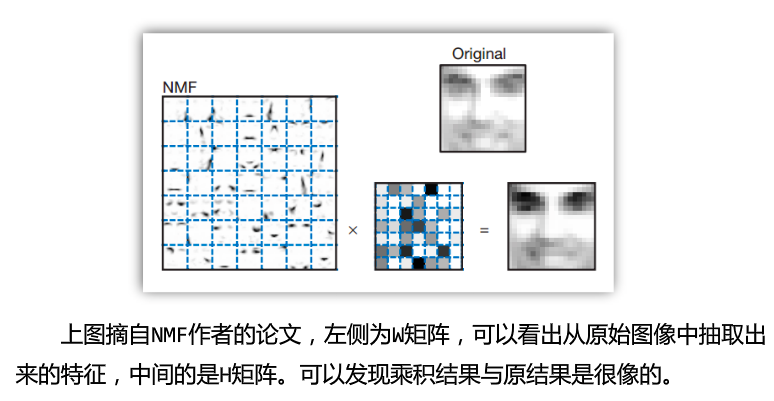
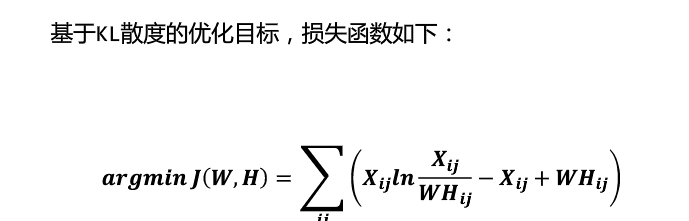
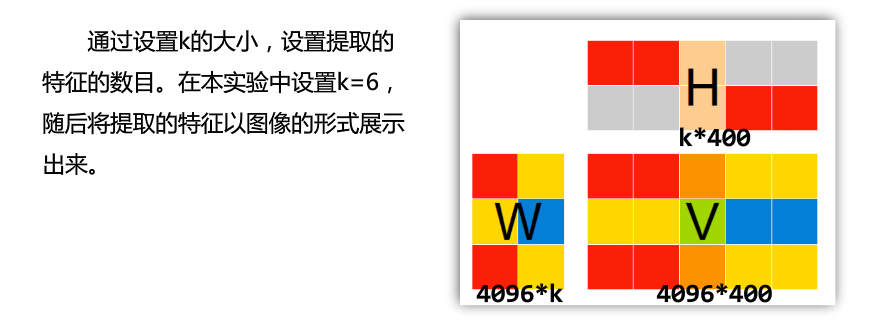
1.介绍


2代码
import matplotlib.pyplot as plt
from numpy.random import RandomState
from sklearn.datasets import fetch_olivetti_faces
from sklearn import decomposition
#全局变量
n_row,n_col=2,3
n_components= n_row*n_col
image_shae=(64,64)

#######################################
#获取数据并打乱顺序
dataset=fetch_olivetti_faces(shuffle= True,random_state=RandomState(0))
# re=RandomState(0)
# print(re.rand(1,2))
faces=dataset.data

#######################################

#确定图片大小以及name
def plot_gallery(title,images,n_col=n_col,n_row=n_row):
    plt.figure(figsize=(2.*n_col,2.26*n_row))
    plt.suptitle(title,size=16)

    for i, comp in enumerate(images):
        plt.subplot(n_row,n_col,i+1) #六组特征数据以i+1的方式选择子图
        vmax=max(comp.max(),-comp.min()) #数据波动绝对值,再max
        plt.imshow(comp.reshape(image_shae),cmap=plt.cm.gray,
                   interpolation='nearest',vmin=-vmax,vmax=vmax)
        #数值归一化,double类型,(uint8 0-255) 以灰度显示

        plt.xticks(())#指定坐标轴刻度,旋转角度rotation=0等操作
        plt.yticks(())
    plt.subplots_adjust(0.01, 0.05, 0.99, 0.94, 0.04, 0.)

#两种方法对比
estimators=[
    ('Eigenfaces - PCA using randomized SVD',
     decomposition.PCA(n_components=6,whiten=True)),
    ('Non-negative components - NMF',
     decomposition.NMF(n_components=6,init='nndsvda',tol=5e-3))
]

#
for name, estimator in estimators:
    print("Extracting the top %d %s..." % (n_components, name))
    print(faces.shape)
    estimator.fit(faces)#导数据fit
    # print(faces)
    components_ = estimator.components_ #投影方向向量
    # print(estimator)
    print(components_[:n_components])  #前六维数据
    plot_gallery(name, components_[:n_components])

plt.show()