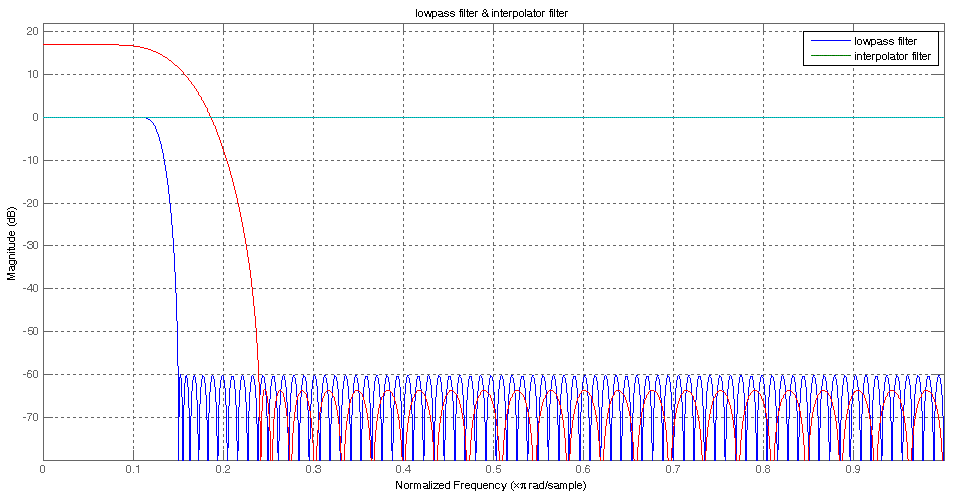
项目里面有用到插值滤波器的场合,用matlab做了前期的滤波器性能仿真,产生的滤波器系数保存下来输入到FPGA IP中使用即可。
下面是仿真的代码
 1 % clear all
 2 close all
 3
 4 Nx = 4096;
 5 Tx = 16;
 6 nx = 0:Nx-1;
 7 x = sin(2*pi*2*nx/Tx);
 8 L = 7;
 9 % Ny = L * Nx;
10 % ny = 0:Ny-1;
11 % yi = zeros(1,Ny);
12 % yi(1:L:Ny) = x;
13 % figure;
14 % stem(yi);
15
16 Fst1 = 0.05;
17 Fp1 = 0.09;
18 Fp2 = 0.11;
19 Fst2 = 0.15;
20 Ast1 = 60;
21 Ap = 0.01;
22 Ast2 = 60;
23 % bandpass filter works well, try lowpass to check whether DC signal affects pm
24 % hband = fdesign.bandpass('Fst1,Fp1,Fp2,Fst2,Ast1,Ap,Ast2',Fst1,Fp1,Fp2,Fst2,Ast1,Ap,Ast2);
25 hband = fdesign.lowpass('Fp,Fst,Ap,Ast',Fp2,Fst2,Ap,Ast2);
26 Hband = design(hband);
27 info(Hband);     %show filter info
28
29 Fp   = 0.08   %pass band corner freq
30 Fst  = 0.24   %stop band corner freq
31 Ap   = 0.01;         %pass band attenuation(dB)
32 Ast  = 80.0;       %stop band attenuation(dB)
33 h1 = fdesign.interpolator(L,'lowpass',Fp,Fst,Ap,Ast);
34 Href = design(h1);
35 info(Href);     %show filter info
36 fvtool(Hband,1,Href,1);  %show freq response
37 title('lowpass filter & interpolator filter');
38 legend('lowpass filter','interpolator filter');
39
40 % import sample_dara
41 a=dlmread('1.prn');%以字符形式打开文件
42 v1=a(:,38); %16进制转化为10进制数,存储进v1矩阵
43 figure;
44 subplot(3,1,1);
45 plot(v1);
46 v2 = filter(Hband,v1);
47 subplot(3,1,2);
48 plot(v2);
49 y = filter(Href,v2);
50 subplot(3,1,3);
51 plot(y);
52 % b=dlmread('2.prn');%以字符形式打开文件
53 % y=b(:,37); %16进制转化为10进制数,存储进v1矩阵
54
55
56 fft_analysis_func(v2,455/14/16, 16);
57 legend('lowpass filter');
58 fft_analysis_func(y,455*L/14/16, 16);
59 legend('interpolator filter');
60
61 %axis([0 25 -120 5])   %zoom-in 0 to 25MHz
62 %generating the coe file
63 ref_filter = Hband.Numerator;
64 gen_coe_rad10(Hband.Numerator,'lowpass_filter_rad10.coe');
65 ref_filter = Href.Numerator;
66 gen_coe_rad10(Href.Numerator,'inter_filter_rad10.coe');
代码中用到了两个函数
function fft_analysis_func(x, fs, adc_width)

%The following program code plots the FFT spectrum of a desired test tone. Test tone based on coherent sampling criteria, and
%computes SNR, SINAD, THD and SFDR.
%This program is believed to be accurate and reliable. This program may get altered without prior notification.;

%fid=fopen('F:pelican_ADC_testvjtag_prjdata_analysissingle_tone.txt','r');
%numpt=input('Number of  Points in FFT? ');
%fclk=input('Sampling Frequency (MHz)? ');
%numbit=input('ADC Resolution (bits)? ');

% numpt=length(x);
numpt = 4096;
fclk=fs;
numbit=adc_width;


v1 = x(1:numpt);

code=v1';

%Warning: ADC output may be clipping - reduce input amplitude
if (max(code)==2^numbit-1) | (min(code)==0)
  disp('WARNING: ADC OUTPUT MAYBE CLIPPING - CHECK INPUT AMPLITUDE!');
end

Dout=code;
Voltage=Dout./((2^numbit-1)/2)*(0.5);


Doutw=(Dout').*blackmanharris(numpt);               %add Minimum 4-term Blackman-Harris window
Dout_spect=fft(Doutw);
Dout_dB=20*log10(abs(Dout_spect));

figure;
maxdB=max(Dout_dB(1:numpt/2));     %numpt points FFT result in numpt/2 points spectrum

%计算距离满量程的幅度差
max_voltage=max(Voltage);
delta_amplitude=20*log10(max_voltage/0.5);      %full scale voltage amplitude is 0.5v

plot([0:numpt/2-1].*fclk/numpt,Dout_dB(1:numpt/2)-maxdB+delta_amplitude);
% plot([0:numpt-1].*fclk/numpt,Dout_dB(1:numpt)-maxdB+delta_amplitude);
grid on;
title('SINGLE TONE FFT PLOT');
xlabel('ANALOG INPUT FREQUENCY (MHz)');
ylabel('AMPLITUDE (dBfs)');

hold off;
function gen_coe_rad10(filt_num, fileName)
%max number of coefficients
num_coeffs = numel(filt_num)
fileId = fopen(fileName,'w');
%header if COE file
fprintf(fileId,'radix = 10;
');
% first coefficient
fprintf(fileId,'coefdata =
');
for i = 1 : num_coeffs-1
    fprintf(fileId,'%8.9f,
',filt_num(i));
end
% last coefficient
fprintf(fileId,'%8.9f;',filt_num(num_coeffs));
fclose(fileId);
end
仿真出的结果如下:

产生了用于滤波器的系数:
 1 radix = 10;
 2 coefdata =
 3 -0.001219138,
 4 -0.002838337,
 5 -0.005111633,
 6 -0.007197151,
 7 -0.007796326,
 8 -0.005351278,
 9 0.001364815,
10 0.012476464,
11 0.026308774,
12 0.039101106,
13 0.045443072,
14 0.039549550,
15 0.017241585,
16 -0.021849408,
17 -0.072532419,
18 -0.123501332,
19 -0.158497326,
20 -0.159275461,
21 -0.109905781,
22 -0.001430991,
23 0.164384860,
24 0.373413481,
25 0.600371089,
26 0.812911647,
27 0.977825248,
28 1.067924092,
29 1.067924092,
30 0.977825248,
31 0.812911647,
32 0.600371089,
33 0.373413481,
34 0.164384860,
35 -0.001430991,
36 -0.109905781,
37 -0.159275461,
38 -0.158497326,
39 -0.123501332,
40 -0.072532419,
41 -0.021849408,
42 0.017241585,
43 0.039549550,
44 0.045443072,
45 0.039101106,
46 0.026308774,
47 0.012476464,
48 0.001364815,
49 -0.005351278,
50 -0.007796326,
51 -0.007197151,
52 -0.005111633,
53 -0.002838337,
54 -0.001219138;