1.1 Grafana简介
1.1.1 Grafana是什么?
一个类似Kibana的东西,也是对后端的数据进行实时展示,那么Grafana和Kibana有什么区别?在我看来区别不大,不过在大家的日常使用中Kibana是跟着Logstash、ElasticSearch等组件一起使用做日志展示、索引、分析的,造成了一种假象就是Kibana就只有这种用法了,Kibana也可以接入其他数据源的,不过大家最长用的还是展示日志。
那么Grafana到底是什么呢?Grafana其实就是一个可视化面板(Dashboard),有着非常漂亮的图表和布局展示,功能齐全的度量仪表盘和图形编辑器,支持Graphite、zabbix、InfluxDB、Prometheus和OpenTSDB作为数据源。随着版本的迭代,支持接入的数据源将会更多。
下面看看官方是怎么解释Grafana的:
grafana是用于可视化大型测量数据的开源程序,他提供了强大和优雅的方式去创建、共享、浏览数据。dashboard中显示了你不同metric数据源中的数据。
grafana最常用于因特网基础设施和应用分析,但在其他领域也有机会用到,比如:工业传感器、家庭自动化、过程控制等等。
grafana有热插拔控制面板和可扩展的数据源,目前已经支持Graphite、InfluxDB、OpenTSDB、Elasticsearch。
Grafana官方网站:https://grafana.com/
1.1.2 如何获取Grafana
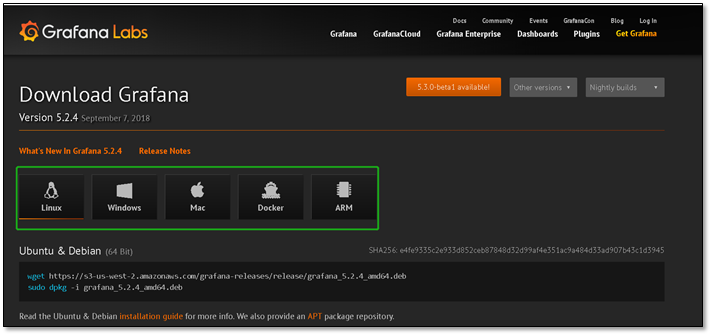
访问Grafana下载页面https://grafana.com/grafana/download在这里可获取该软件的全版本。
可以按照使用需求,进行下载相应版本。
1.2 安装Grafana
1.2.1 系统环境说明
[root@monitor.clsn.io /root]
#cat  /etc/redhat-release
CentOS Linux release 7.5.1804 (Core)

[root@monitor.clsn.io /root]
#uname -r
3.10.0-862.el7.x86_64

[root@monitor.clsn.io /root]
#systemctl  status firewalld.service
● firewalld.service - firewalld - dynamic firewall daemon
   Loaded: loaded (/usr/lib/systemd/system/firewalld.service; disabled; vendor preset: enabled)
   Active: inactive (dead)
     Docs: man:firewalld(1)

[root@monitor.clsn.io /root]
#sestatus
SELinux status:                 disabled
1.2.2 安装Grafana
在这次安装中,我们使用的是grafana-5.2.4版本。不同版本之间功能存在着一定的差距。
[root@monitor.clsn.io /root]
#wget https://s3-us-west-2.amazonaws.com/grafana-releases/release/grafana-5.2.4-1.x86_64.rpm

[root@monitor.clsn.io /root]
#ls
grafana-5.2.4-1.x86_64.rpm

[root@monitor.clsn.io /root]
#sudo yum localinstall grafana-5.2.4-1.x86_64.rpm
1.2.3 启动Grafana
[root@monitor.clsn.io /root]
#systemctl  start grafana-server.service

[root@monitor.clsn.io /root]
#systemctl enable grafana-server.service
1.2.4 检查监听端口
Grafana默认监听端口为3000,可以通过修改配置文件(/etc/grafana/grafana.ini)对其做定制化配置。
[root@monitor.clsn.io /root]
#netstat  -lntup |grep grafana
tcp6       0      0 :::3000                 :::*                    LISTEN      1333/grafana-server
1.3 Grafana的使用
1.3.1 访问界面
通过流量器访问 http://ip:3000 即可访问grafana页面,初始用户名与密码均为admin,可在登陆是修改默认密码。
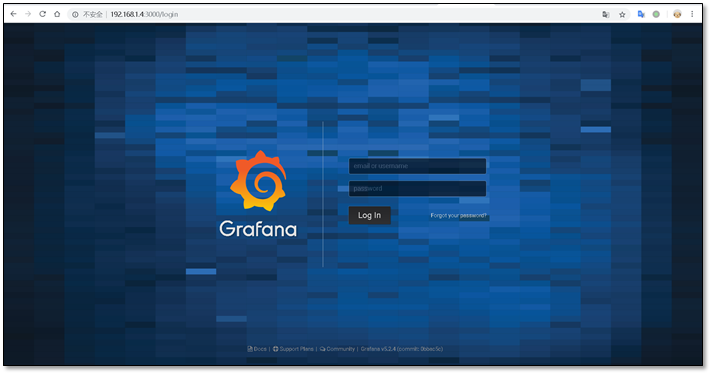
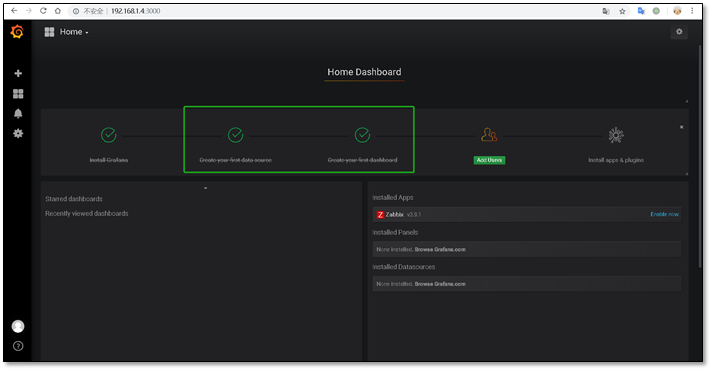
登陆成功之后可以先进行创建第一个数据源,以及第一个展示面板。
1.3.2 Grafana For Zabbix
使用Zabbix收集数据,Grafana展示图形,许多的公司都是这么做的。Grafana默认没有zabbix作为数据源,我们需要手动给zabbix安装一个插件,然后再添加进Grafana即可。
关于zabbix的安装可以参照以下文章进行配置。
惨绿少年博客:https://www.cnblogs.com/clsn/p/7885990.html
zabbix官方文档:https://www.zabbix.com/documentation/3.4/zh/manual
注:本次使用zabbix版本为3.4.14。
[root@monitor.clsn.io /root]
#zabbix_server -V
zabbix_server (Zabbix) 3.4.14
Revision 84877 14 September 2018, compilation time: Sep 14 2018 08:09:35

Copyright (C) 2018 Zabbix SIA
License GPLv2+: GNU GPL version 2 or later <http://gnu.org/licenses/gpl.html>.
This is free software: you are free to change and redistribute it according to
the license. There is NO WARRANTY, to the extent permitted by law.
1.3.3 获取grafana for zabbix 插件
通过grafana-cli plugins list-remote命令 可以获取到grafana的插件列表。
[root@monitor.clsn.io /root]
#grafana-cli plugins list-remote  |grep  zabbix
id: alexanderzobnin-zabbix-app version: 3.9.1
从上可以查询到插件版本为3.9.1
安装插件
[root@monitor.clsn.io /root]
#grafana-cli plugins install alexanderzobnin-zabbix-app
installing alexanderzobnin-zabbix-app @ 3.9.1
from url: https://grafana.com/api/plugins/alexanderzobnin-zabbix-app/versions/3.9.1/download
into: /var/lib/grafana/plugins

✔ Installed alexanderzobnin-zabbix-app successfully
Restart grafana after installing plugins . <service grafana-server restart>
出现√即为安装成功。在安装完成后无比重启grafana使其生效。
[root@monitor.clsn.io /root]
#systemctl  restart grafana-server.service
1.3.4 配置zabbix源
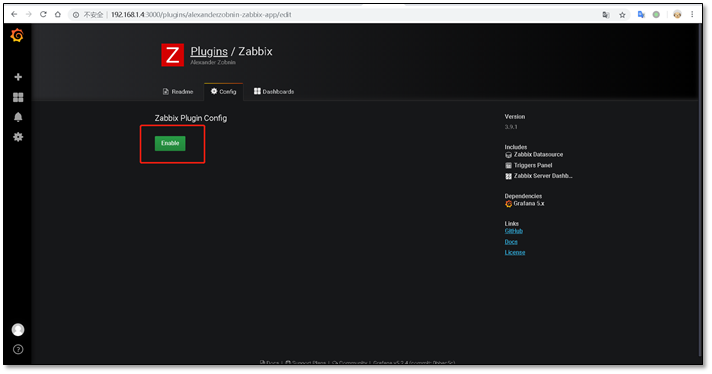
登陆grafana页面,开启zabbix插件。
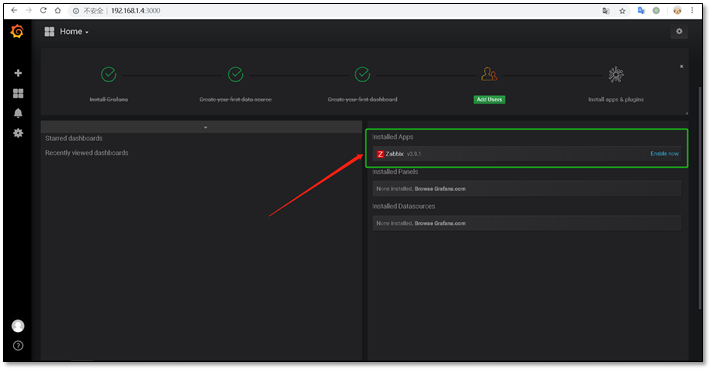
点击enable开启插件。
添加zabbix数据源
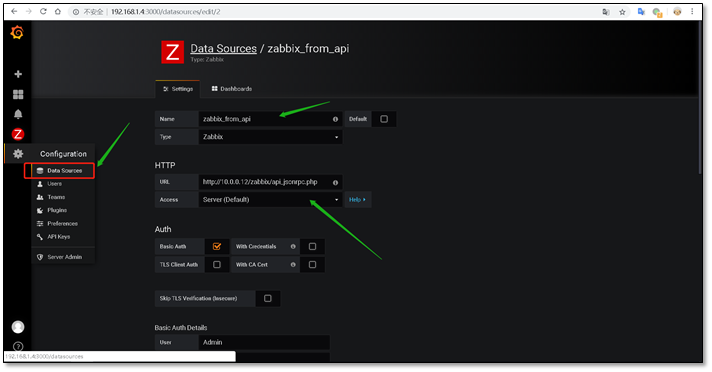
相关配置项目说明:
|
配置项目 |
说明 |
|
Name |
给数据源起一个名字。 |
|
Default |
选择默认,意味着数据源将预先选定为新的面板。 |
|
Type |
选择数据源的类型。 |
|
Url |
这里的Url是http协议,地址和端口是zabbix-web提供的接口。或为zabbix的api地址。 |
|
Access |
访问代理,这里选择了proxy表示Grfana通过后端访问,还有direct值表示从浏览器直接访问目录。 |
|
Username |
输入zabbix的用户名,需要进行认证,一般使用管理员。 |
|
Password |
输入zabbix用户的密码。 |
代理(proxy)访问意味着的Grafana后端将从浏览器代理所有请求,并将它们发送到数据源。这样是有用的,因为它可以消除CORS(交叉来源站点资源)的问题,如消除需要传播到数据源到浏览器的身份验证详细信息。但还支持直接(direct)访问,因为在某些情况下可能用来访问直接根据用例和拓扑结构的Grafana、 用户和数据源的数据源。
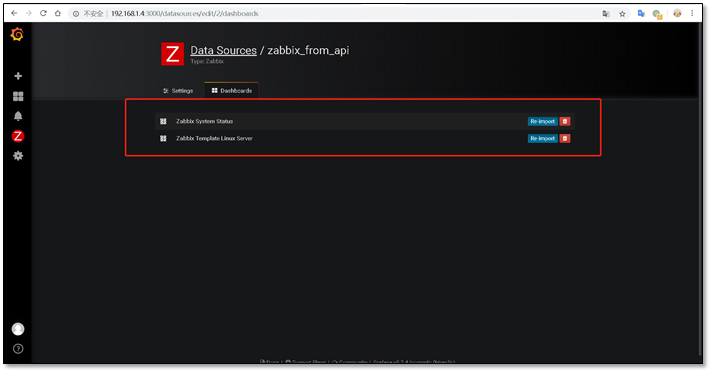
以上信息都填写完成之后点击Save & Test,一般只要看见Success就表示成功了,下面就可以去利用zabbix中数据添加图形了。
下面先引入zabbix自带的dashboard,点击import。
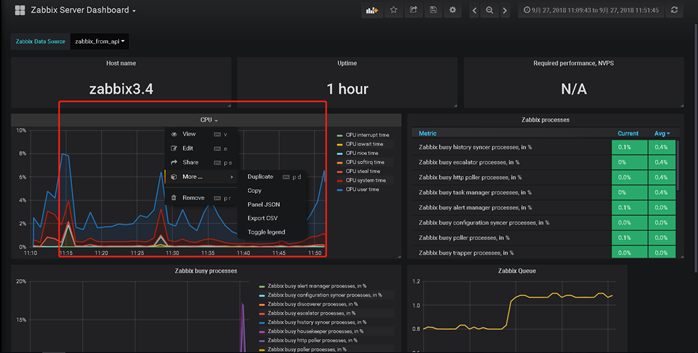
1.3.5 查看zabbix dashboard页面
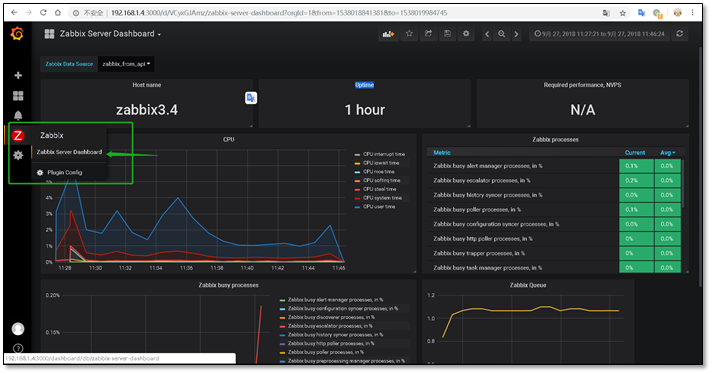
使用grafana的好处是对图形的自定义更加简便,通过变更不同的json文件,即可在数据源中查找到想要的结果,然后绘制出图。
1.4 附录
1.4.1 grafana-cli命令
安装插件最简单的方法是使用与grafana捆绑在一起的CLI工具grafana-cli。在修改插件之后发生任何修改之前,grafana服务器需要重新启动。
Grafana插件安装目录
在Linux系统上,grafana-cli会假定grafana插件目录是/var/lib/grafana/plugins。通过指定-pluginsDir标志可以覆盖grafana-cli将要运行的目录。在Windows系统中,必须为每个呼叫指定此参数
Grafana-cli命令说明
列出可用的插件
#grafana-cli plugins list-remote

安装最新版本的插件
#grafana-cli plugins install <plugin-id>

安装特定版本的插件
#grafana-cli plugins install <plugin-id> <version>

列出安装的插件
#grafana-cli plugins ls

更新所有安装的插件
#grafana-cli plugins update-all

更新一个插件
#grafana-cli plugins update <plugin-id>

删除一个插件
#grafana-cli plugins remove <plugin-id>
1.5 参考文献
[1] https://www.cnblogs.com/clsn/p/7885990.html
[2] http://www.ywnds.com/?cat=122
[3] https://github.com/grafana/grafana/
[4] https://grafana.com/grafana/download
[5] https://blog.csdn.net/m0_37814112/article/details/80476364