项目需求
本项目从impala获取到的数据为用户地理位置数据,每小时的数据量大概在8000万条,数据格式如下:

公司要求对这些用户按照聚集程度进行划分,将300米范围内用户数大于200的用户划分为一个簇,并计算这个簇的中心点和簇的边界点。
附模拟的数据:https://files.cnblogs.com/files/dotafeiying/test.zip
实现原理
下面我们来一步一步实现上述需求:
1、将用户按照聚集程度进行划分
我们可以选择基于密度的聚类算法DBscan算法,DBSCAN算法的重点是选取的聚合半径参数eps和聚合所需指定的数目min_samples,正好对应这里的300米和200个用户。但是需要注意的是,dbscan算法的默认距离度量为欧几里得距离,而我们需要的是球面距离,所以需要定制我们自己的距离算法运用到dbscan算法中。解决方法是:将dbscan设置为 metric='precomputed' ,这时fit传入的X参数必须为相似度矩阵,然后fit函数会直接用你这个矩阵来进行计算。这意味着我们可以用我们自定义的距离事先计算好各个向量的相似度,然后调用这个函数来获得结果。
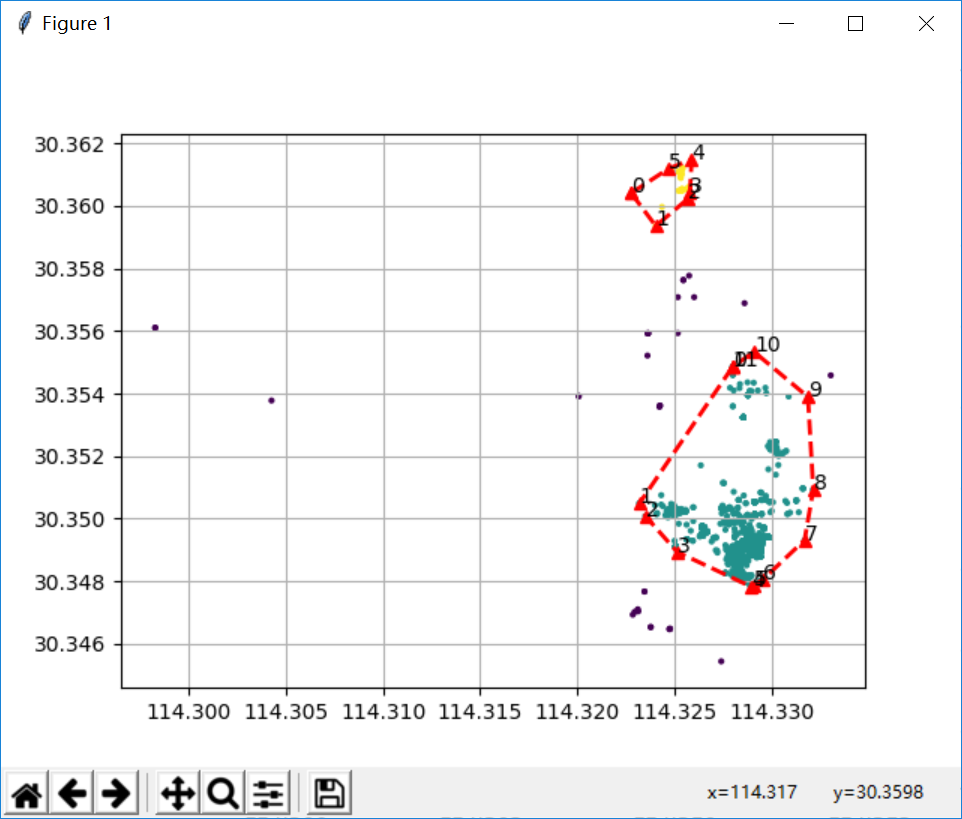
2、识别簇的边界点
这里我使用凸包算法来计算簇的边界点,那么问题就变成:如何求一个平面内所有点的最小凸边形。在scipy.spatial 和opencv 分别有计算凸包的函数,不清楚的可以自行百度。
3、计算簇的中心点
由于dbscan算法中并没有提到获取簇中心点的方法,那么我们就需要自己设计来计算簇的中心点。现在簇的所有点已知,我们可以利用k-means算法来计算簇的中心点,只需要设置K=1(即质心为1)。
实现代码
# -*- coding:utf-8 -*-
from math import radians, cos, sin, asin, sqrt,degrees
import pandas as pd
import numpy as np
import matplotlib.pyplot as plt
from sklearn.cluster import DBSCAN, KMeans
from scipy.spatial import ConvexHull
from sklearn.cluster import MeanShift, estimate_bandwidth
from scipy.spatial.distance import pdist, squareform
from sklearn import metrics

pd.set_option('display.width', 400)
pd.set_option('display.expand_frame_repr', False)
pd.set_option('display.max_columns', 70)

def haversine(lonlat1, lonlat2):
    lat1, lon1 = lonlat1
    lat2, lon2 = lonlat2
    lon1, lat1, lon2, lat2 = map(radians, [lon1, lat1, lon2, lat2])
    dlon = lon2 - lon1
    dlat = lat2 - lat1
    a = sin(dlat / 2) ** 2 + cos(lat1) * cos(lat2) * sin(dlon / 2) ** 2
    c = 2 * asin(sqrt(a))
    r = 6371  # Radius of earth in kilometers. Use 3956 for miles
    return c * r

if __name__=='__main__':
    df=pd.read_csv('test.csv')
    print(df.head())
    X=df[['mr_longitude','mr_latitude']].values

    radius = 200
    epsilon = radius / 100000
    min_samples = 40

    # model = DBSCAN(eps=epsilon, min_samples=min_samples)
    # y_pred = model.fit_predict(X)

    # # 自定义度量距离
    distance_matrix = squareform(pdist(X, (lambda u, v: haversine(u, v))))
    db = DBSCAN(eps=300, min_samples=200, metric='precomputed')
    y_pred = db.fit_predict(distance_matrix)
    print(y_pred.tolist())

    n_clusters_ = len(set(y_pred)) - (1 if -1 in y_pred else 0)  # 获取分簇的数目
    print('分簇的数目:',n_clusters_)
    df['label'] = y_pred

    df_group = df[df['label'] != -1][['mr_longitude', 'mr_latitude', 'label']].groupby(['label'])
    plt.figure(facecolor='w')
    for label, group in df_group:
        points = group[['mr_longitude', 'mr_latitude']].values
        # 得到凸轮廓坐标的索引值,逆时针画
        hull = ConvexHull(points).vertices.tolist()
        hull.append(hull[0])
        plt.plot(points[hull, 0], points[hull, 1], 'r--^', lw=2)
        for i in range(len(hull) - 1):
            plt.text(points[hull[i], 0], points[hull[i], 1], str(i), fontsize=10)
    plt.scatter(X[:, 0], X[:, 1], c=y_pred,s=4)
    plt.grid(True)
    plt.show()
可视化

实际项目中的效果图
