var nodes = [{
x: 500,
y: 1000,
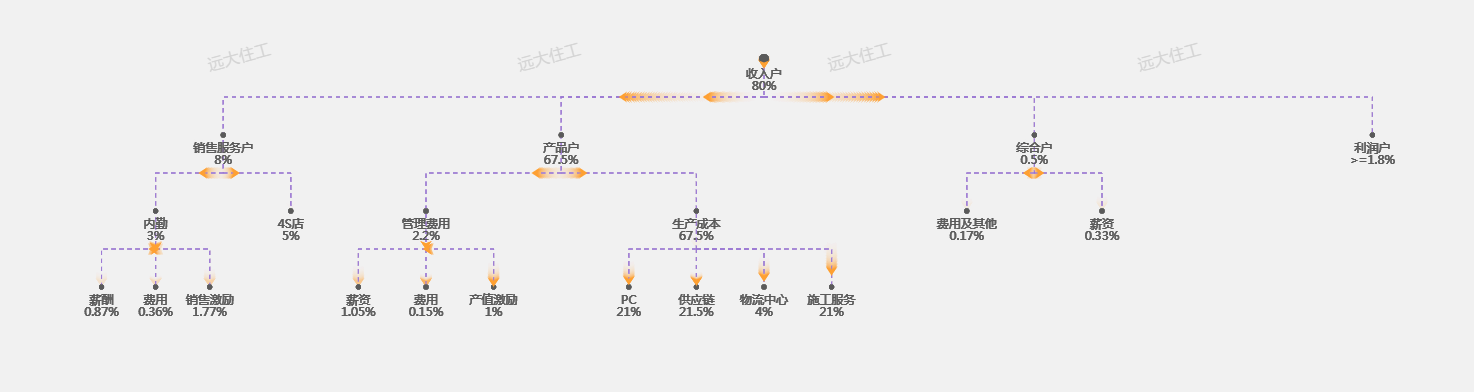
nodeName: '收入户
80%',
symbolSize: 10
}, {
x: 100,
y: 800,
nodeName: '销售服务户
8%'
},
{
x: 350,
y: 800,
nodeName: '产品户
67.5%'
},
{
x: 700,
y: 800,
nodeName: '综合户
0.5%'
},
{
x: 950,
y: 800,
nodeName: '利润户
>=1.8%'
},
{
x: 50,
y: 600,
nodeName: '内勤
3%'
},
{
x: 150,
y: 600,
nodeName: '4S店
5%'
},
{
x: 250,
y: 600,
nodeName: '管理费用
2.2%'
},
{
x: 450,
y: 600,
nodeName: '生产成本
67.5%'
},
{
x: 650,
y: 600,
nodeName: '费用及其他
0.17%'
},
{
x: 750,
y: 600,
nodeName: '薪资
0.33%'
},
{
x: 10,
y: 400,
nodeName: '薪酬
0.87%'
},
{
x: 50,
y: 400,
nodeName: '费用
0.36%'
},
{
x: 90,
y: 400,
nodeName: '销售激励
1.77%'
},
{
x: 200,
y: 400,
nodeName: '薪资
1.05%'
},
{
x: 250,
y: 400,
nodeName: '费用
0.15%'
},
{
x: 300,
y: 400,
nodeName: '产值激励
1%'
},
{
x: 400,
y: 400,
nodeName: 'PC
21%'
},
{
x: 450,
y: 400,
nodeName: '供应链
21.5%'
},
{
x: 500,
y: 400,
nodeName: '物流中心
4%'
},
{
x: 550,
y: 400,
nodeName: '施工服务
21%'
},
];
var charts = {
nodes: [],
lines: [{
coords: [
[500, 1000], //节点坐标
[500, 900] //子节点起点(没有子节点,则不需要)
]
}, {
coords: [
[500, 900], //连接父节点起点
[100, 900], //节点衔接点(折线拐点)
[100, 850], //节点坐标
[100, 700] //子节点起点
]
}, {
coords: [
[500, 900],
[350, 900],
[350, 800],
[350, 700]
]
}, {
coords: [
[500, 900],
[700, 900],
[700, 800],
[700, 700]
]
},{
coords: [
[500, 900],
[950, 900],
[950, 800]
]
},
{
coords: [
[100, 700],
[50, 700],
[50, 600],
[50, 500]
]
},
{
coords: [
[100, 700],
[150, 700],
[150, 600]
]
},
{
coords: [
[350, 700],
[250, 700],
[250, 600],
[250, 500]
]
},
{
coords: [
[350, 700],
[450, 700],
[450, 600],
[450, 500]
]
},
{
coords: [
[700, 700],
[650, 700],
[650, 600]
]
},
{
coords: [
[700, 700],
[750, 700],
[750, 600]
]
},
{
coords: [
[50, 500],
[10, 500],
[10, 400]
]
},
{
coords: [
[50, 500],
[50, 500],
[50, 400]
]
},
{
coords: [
[50, 500],
[90, 500],
[90, 400]
]
} ,
{
coords: [
[250, 500],
[200, 500],
[200, 400]
]
},
{
coords: [
[250, 500],
[250, 500],
[250, 400]
]
},
{
coords: [
[250, 500],
[300, 500],
[300, 400]
]
},
{
coords: [
[450, 500],
[400, 500],
[400, 400]
]
},
{
coords: [
[450, 500],
[450, 500],
[450, 400]
]
},
{
coords: [
[450, 500],
[500, 500],
[500, 400]
]
},
{
coords: [
[450, 500],
[550, 500],
[550, 400]
]
}
]
};
for (var j = 0; j < nodes.length; j++) {
const {
x,
y,
nodeName,
symbolSize
} = nodes[j];
var node = {
nodeName,
value: [x, y],
symbolSize: symbolSize || 5
}
charts.nodes.push(node)
};
function SetChart() {
var myChart = echarts.init(document.getElementById('myChart'));
option = {
backgroundColor: "#f2f2f2",
xAxis: {
min: 0,
max: 1000,
show: false,
type: 'value'
},
yAxis: {
min: 0,
max: 1000,
show: false,
type: 'value'
},
series: [{
type: 'graph',
coordinateSystem: 'cartesian2d',
label: {
normal: {
show: true,
position: 'bottom',
color: '#04FDB8'
}
, textStyle: {
color: '#04FDB8'
}
},
itemStyle: {
normal: {
label: {
show: true,
color: '#04FDB8',
formatter: function (item) {
return item.data.nodeName
}
},
color: '#5b5b5b'
}
},
data: charts.nodes,
},
{
type: 'lines',
polyline: true,
coordinateSystem: 'cartesian2d',
lineStyle: {
normal: {
type: 'dashed',
1,
curveness: 0.2,
color: '#956FD4'
}
},
//动画
effect: {
show: true,
trailLength: 0.1,
symbol: 'arrow',
color: '#FFA12F',
symbolSize: 8
},
data: charts.lines
}]
};
myChart.setOption(option);
};
<div id="myChart" style="100%;min-height: 500px;"></div>
效果:
引用echarts.js:
<script src="../js/echarts/echarts.js"></script>