


Python vs R and Matlab

You will be using the Python data analysis library pandas extensively.
You will also occasionally need to dabble in NumPy, SciPy and matplotlib. But don't worry, these libraries work very well together.
Lesson outline
In this lesson you will learn how to read data, select subsets of it and generate useful plots, using pandas and matplotlib. The documentation links below are for your reference.
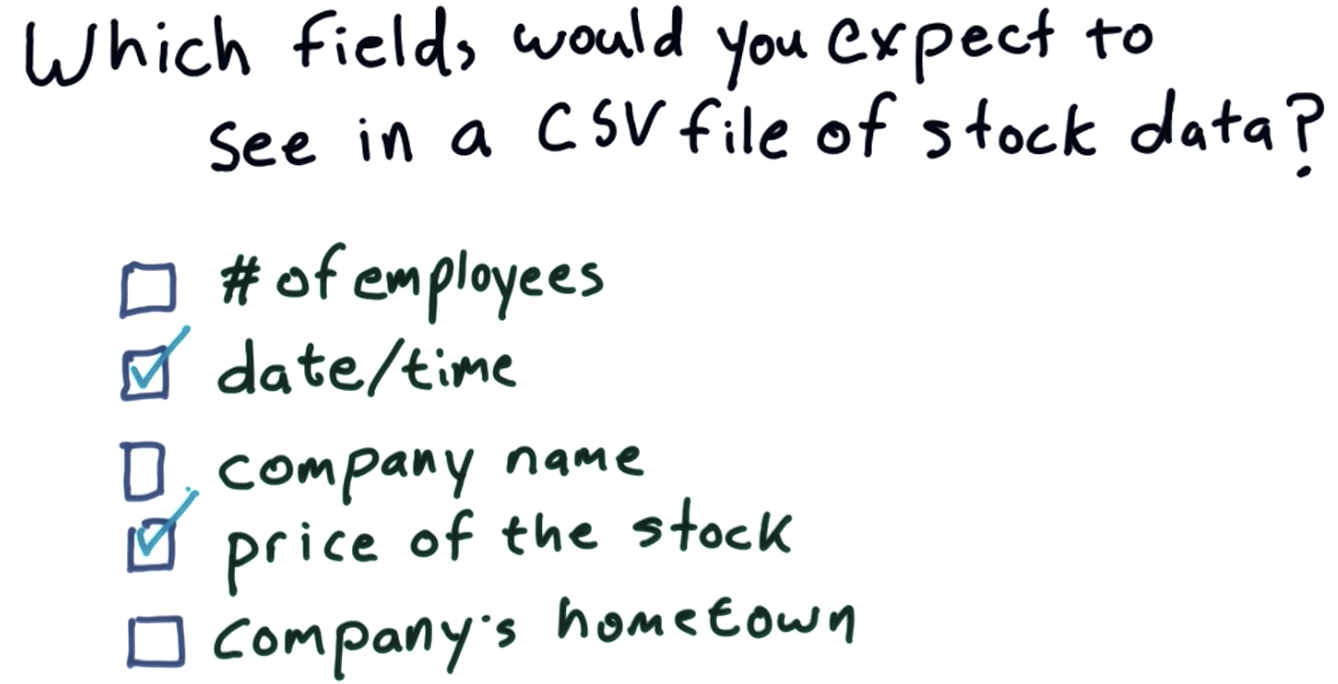
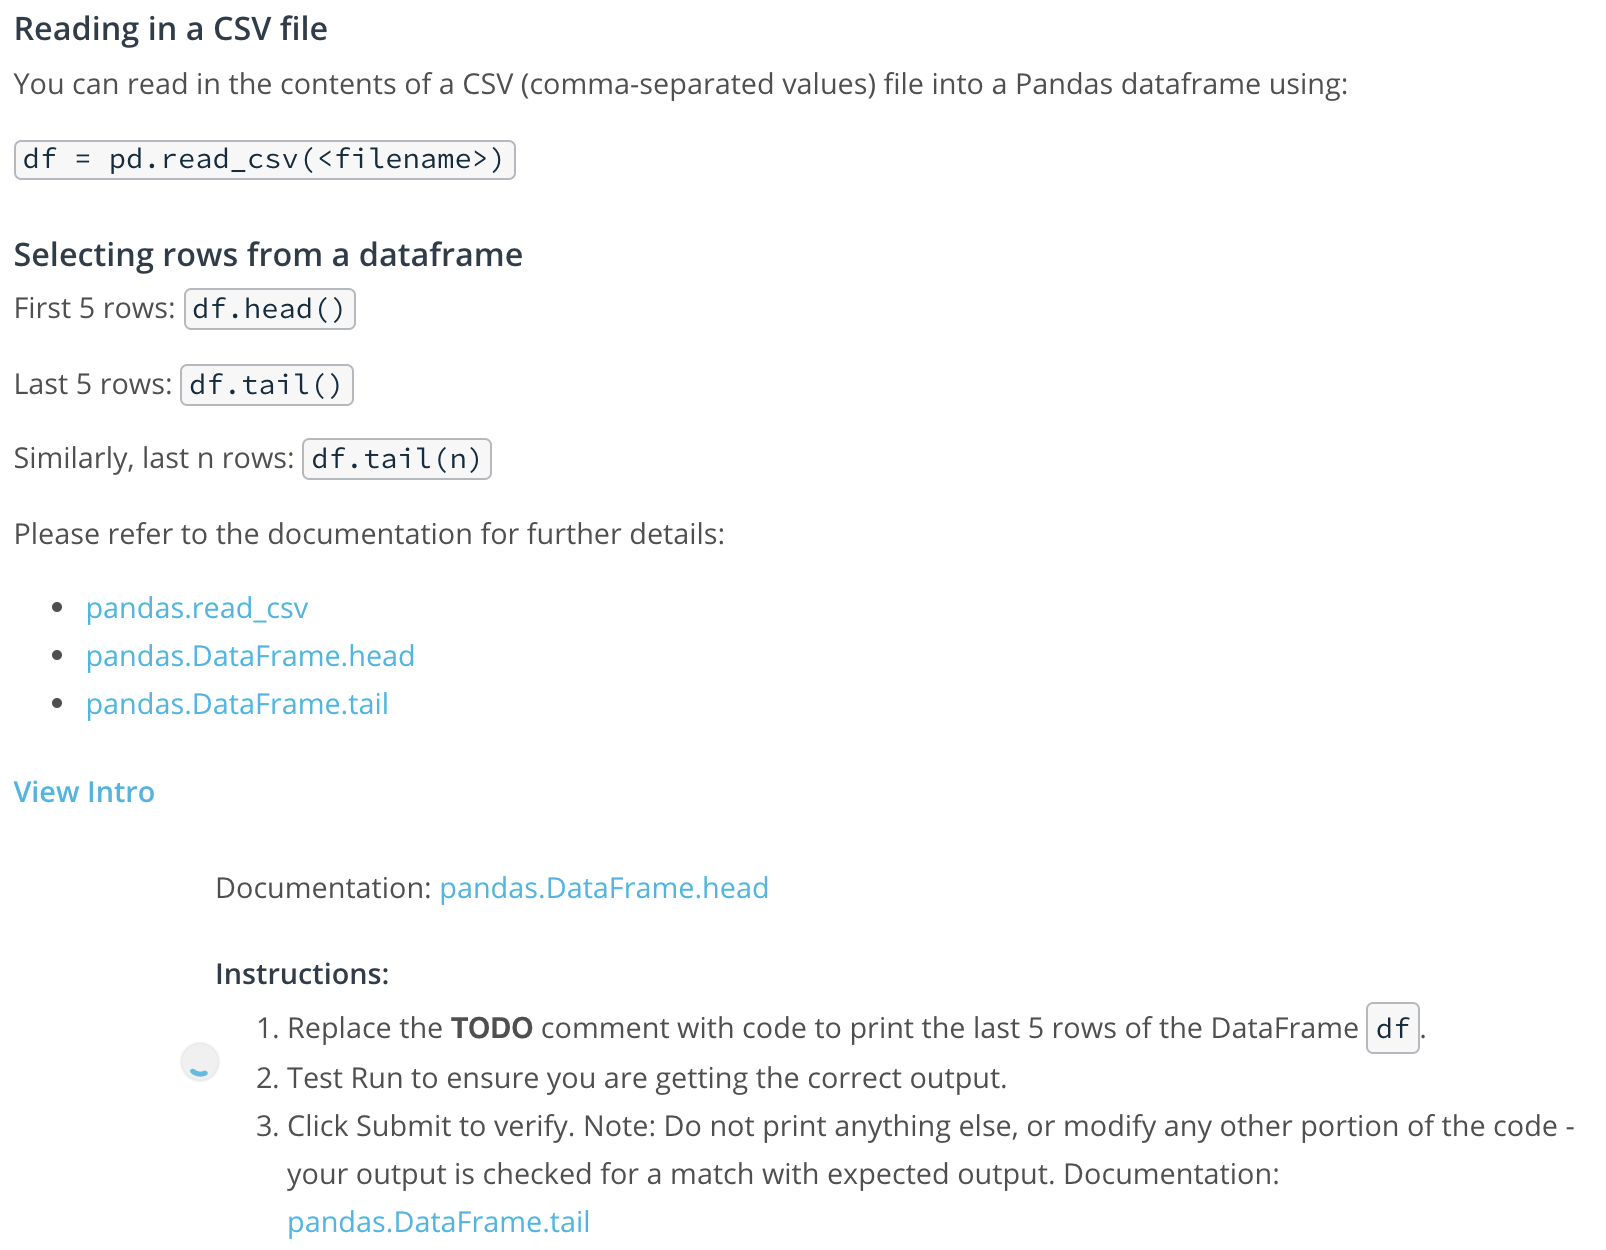
- Read stock data from CSV files:
- Select desired rows and columns:
- Visualize data by generating plots:
Hit Next to continue with the lesson.

Note: CSV = Comma-Separated-Values
Keep an eye out for notes and documentation links in this area throughout the course.
HCP stock data on Yahoo Finance: [summary | table | chart]

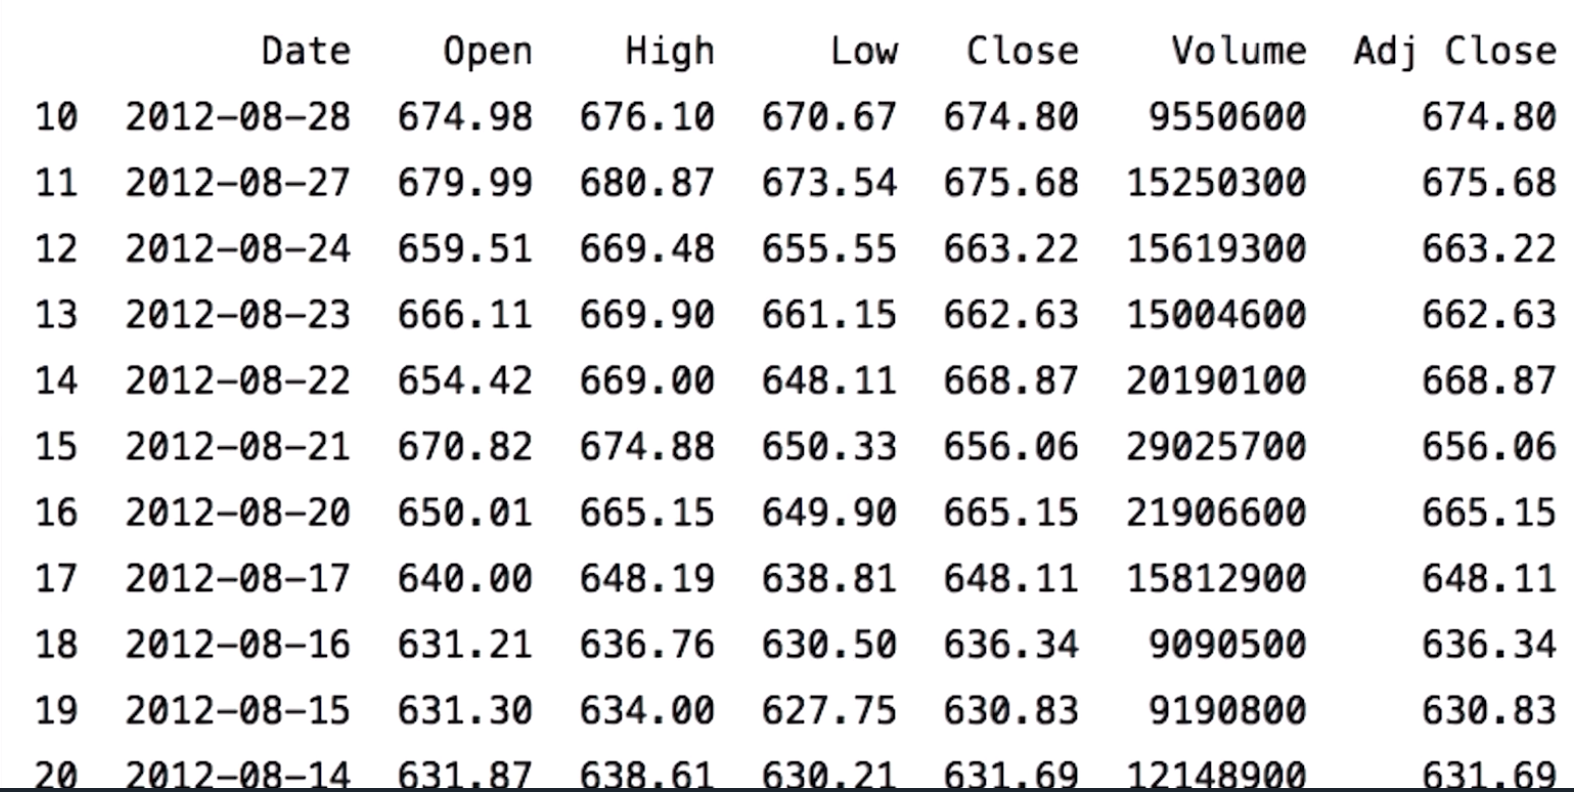
Open: first price
Close: final price
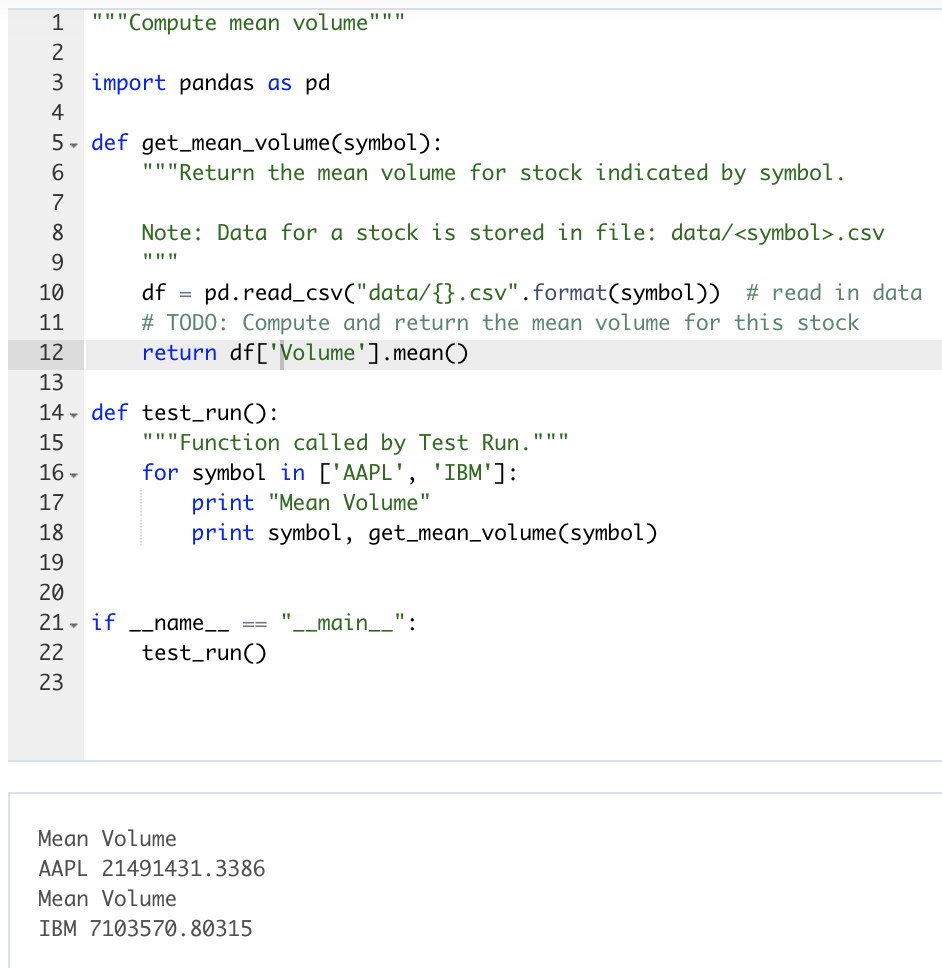
Volume: how many shares of the stock traded
Adj Close: close price adjusted by splits, dividend payments, etc. => last day, close = adj close => longer ago, more difference
Python data analysis library: pandas
Documentation: pandas.DataFrame

pandas is createed by Wes McKinney at a hedge fund called AQR, used at many hedge funds and by many people in the finance industry
Select rows

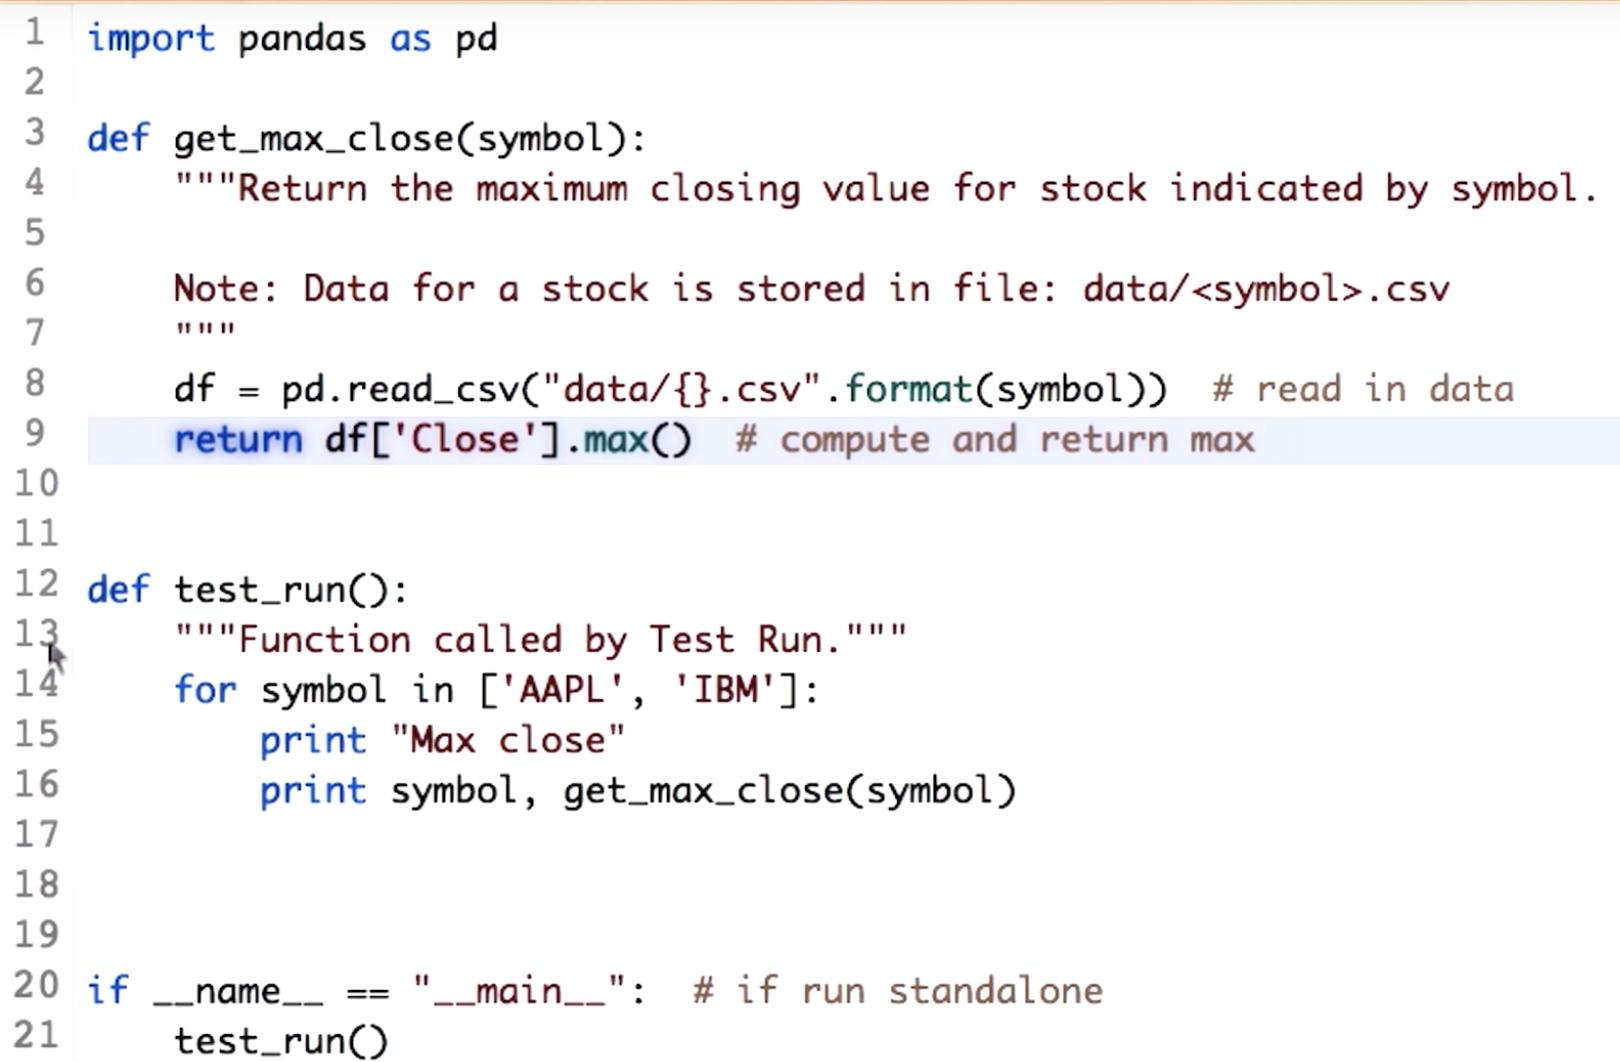
Compute max closing price

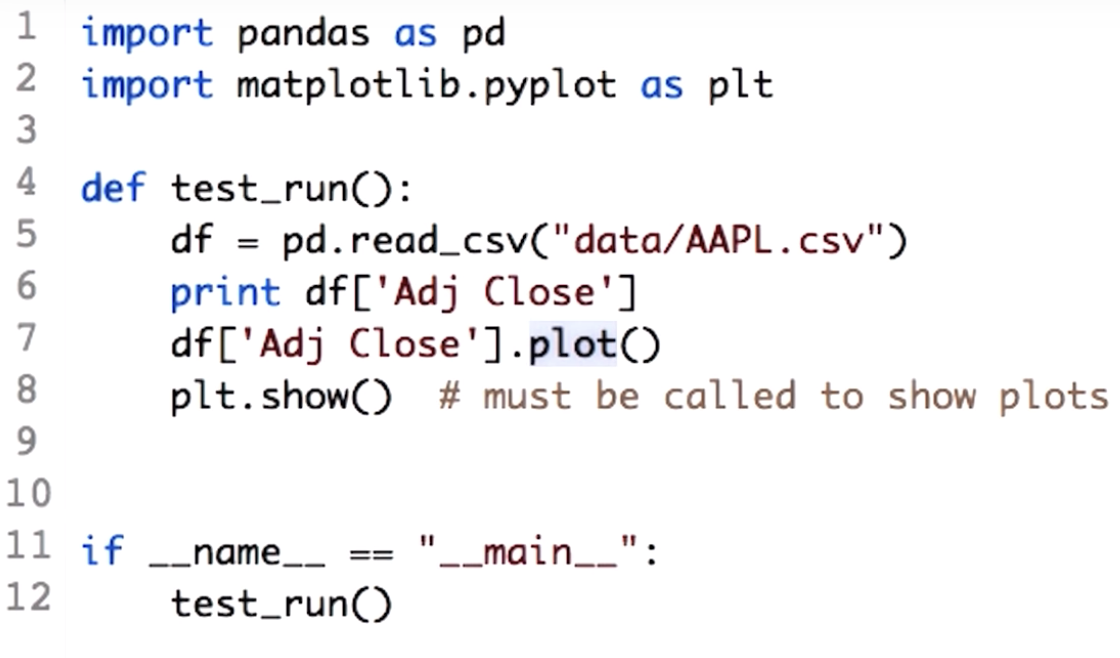
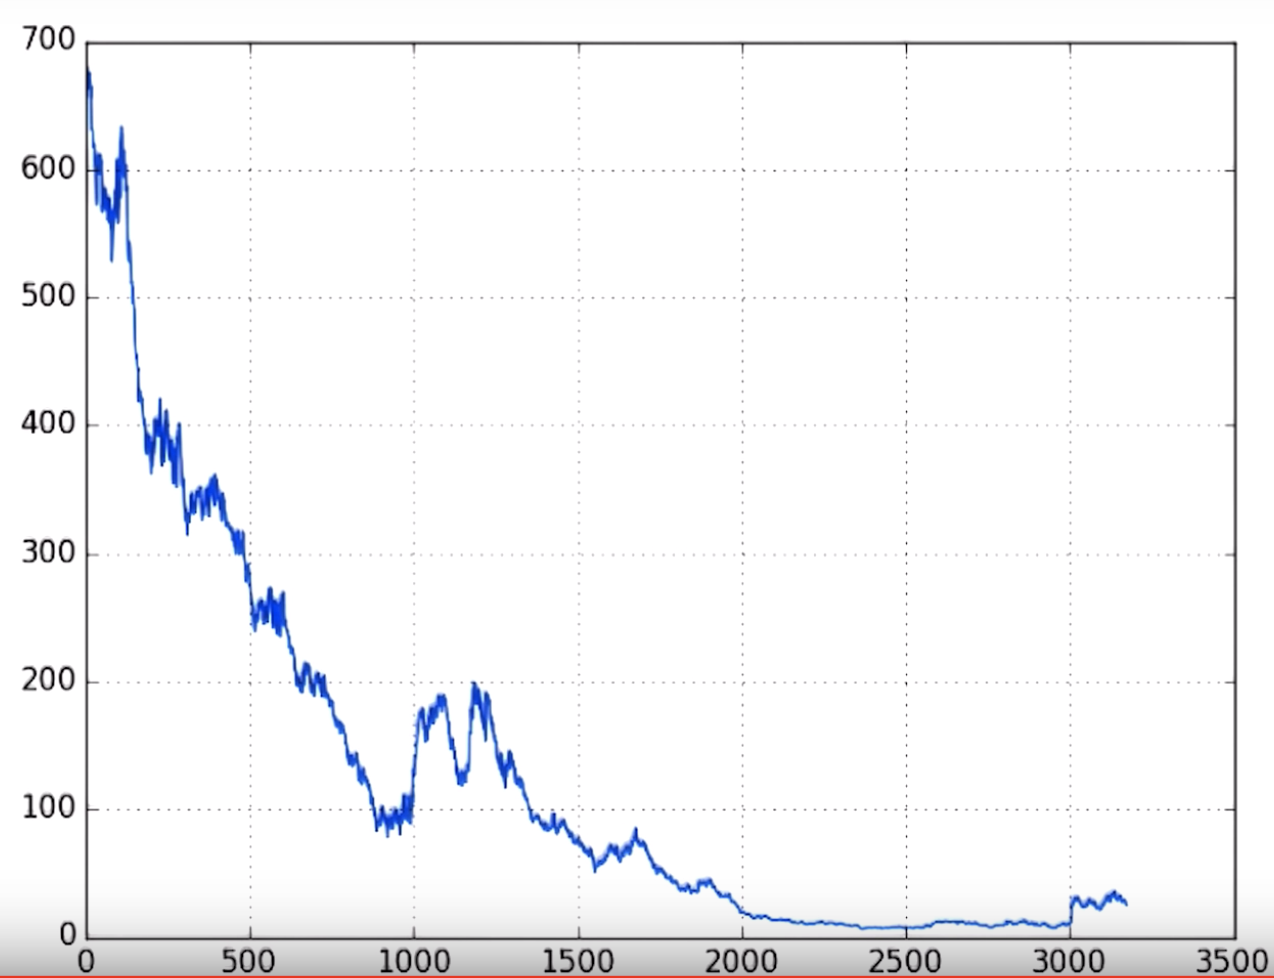
Plotting stock price data
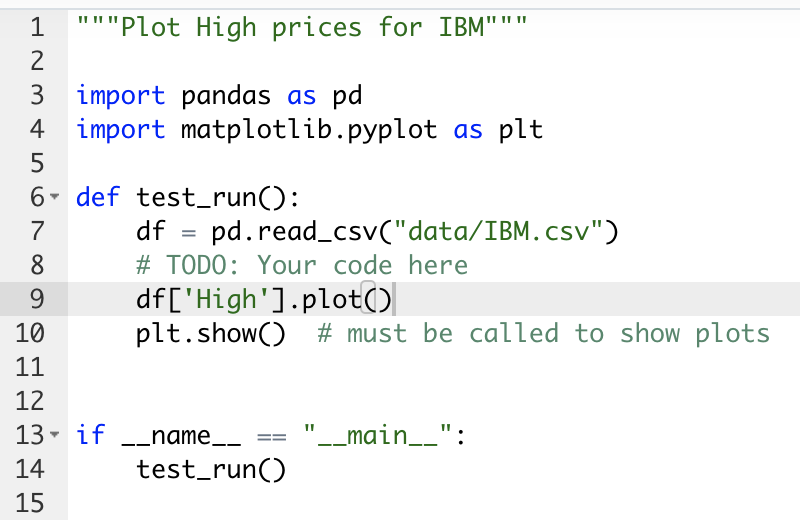
Plot High prices for IBM

Plot two columns

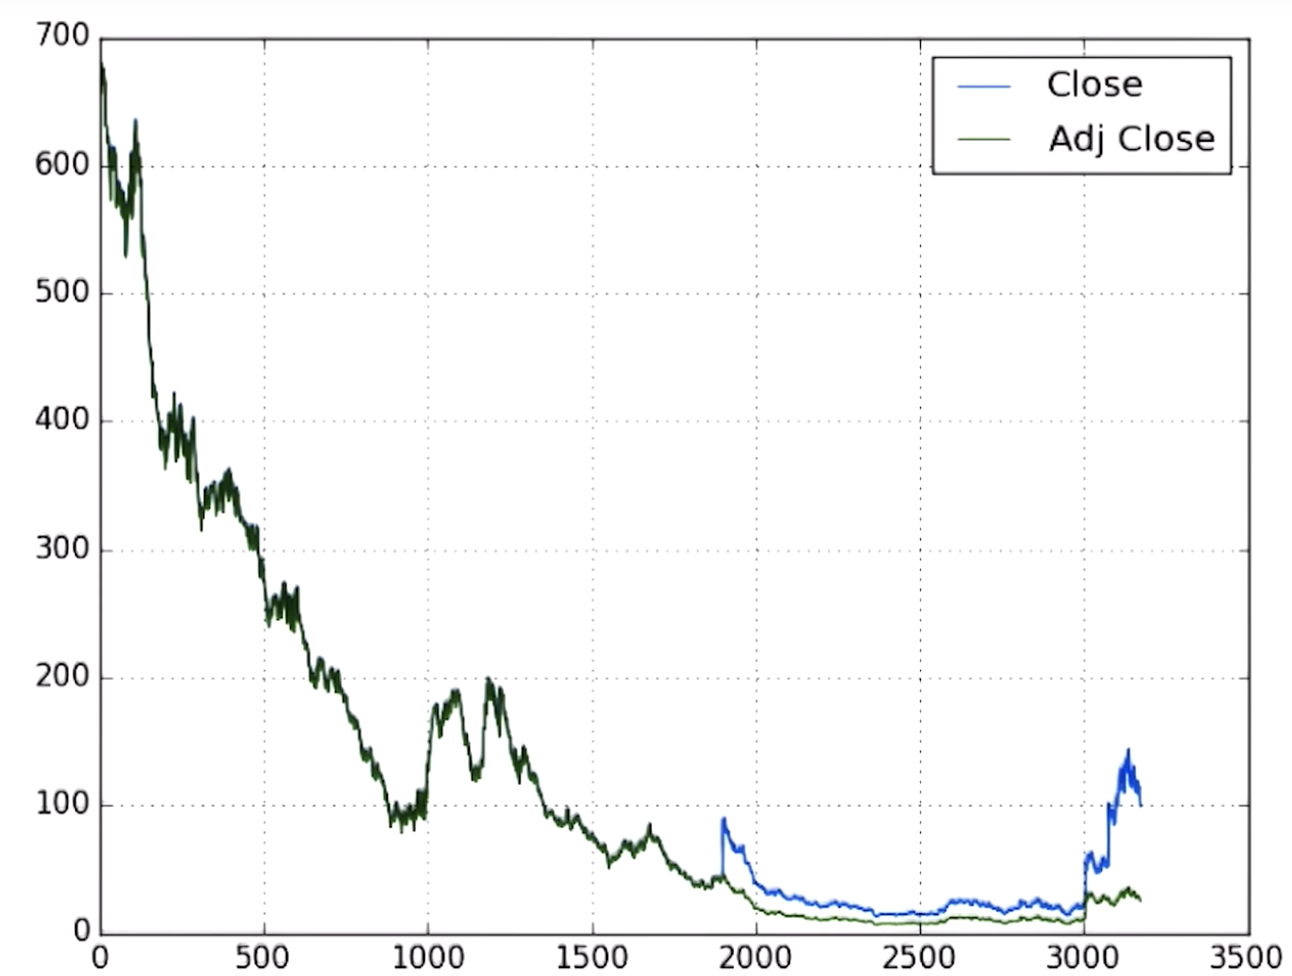
Note: 'Adj Close' stands for 'Adjusted Close' or 'Adjusted Closing Price' which is a historically-adjusted value of the stock that takes into account corporate actions (such as stock splits) and distributions (such as dividends issued).