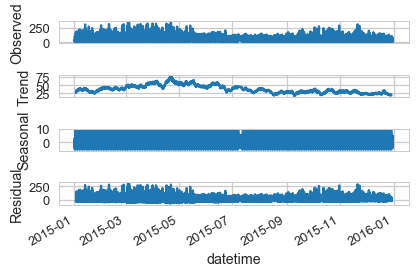
You can plot a bigger graph by plotting each graph separately. For example,
fig, (ax1,ax2,ax3) = plt.subplots(3,1, figsize=(15,8))
res.trend.plot(ax=ax1)
res.resid.plot(ax=ax2)
res.seasonal.plot(ax=ax3)
Just use that before the plot and you will be fine:
pylab.rcParams['figure.figsize'] = (14, 9)
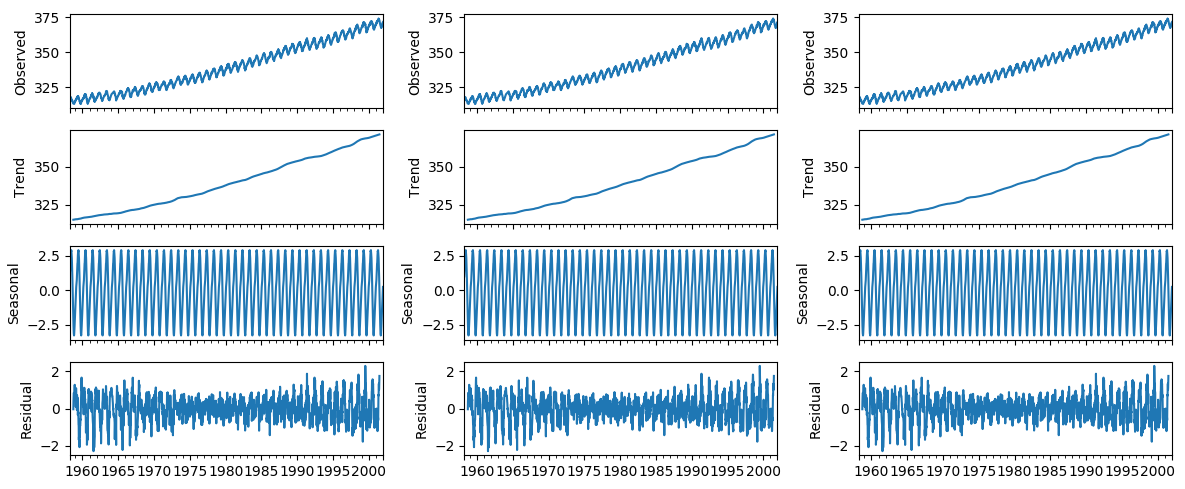
import matplotlib.pyplot as plt
import statsmodels.api as sm

dta = sm.datasets.co2.load_pandas().data
dta.co2.interpolate(inplace=True)
res = sm.tsa.seasonal_decompose(dta.co2)

def plotseasonal(res, axes ):
    res.observed.plot(ax=axes[0], legend=False)
    axes[0].set_ylabel('Observed')
    res.trend.plot(ax=axes[1], legend=False)
    axes[1].set_ylabel('Trend')
    res.seasonal.plot(ax=axes[2], legend=False)
    axes[2].set_ylabel('Seasonal')
    res.resid.plot(ax=axes[3], legend=False)
    axes[3].set_ylabel('Residual')


dta = sm.datasets.co2.load_pandas().data
dta.co2.interpolate(inplace=True)
res = sm.tsa.seasonal_decompose(dta.co2)

fig, axes = plt.subplots(ncols=3, nrows=4, sharex=True, figsize=(12,5))

plotseasonal(res, axes[:,0])
plotseasonal(res, axes[:,1])
plotseasonal(res, axes[:,2])

plt.tight_layout()
plt.show()
REF
https://gist.github.com/balzer82/5cec6ad7adc1b550e7ee
https://stackoverflow.com/questions/45184055/how-to-plot-multiple-seasonal-decompose-plots-in-one-figure