#对如下红色图形进行面积估算
x = np.linspace(0, 2, 1000)#在0~2之间产生1000个样本点x
y = x **3 #求出对应的y值
plt.plot(x, y)
plt.fill_between(x, y, where=(y >0), color='red', alpha=0.5)#画出y>0的面积进行填充
plt.show()
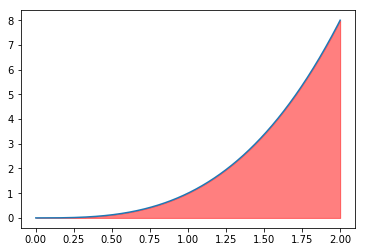
该红色区域在一个2×8的矩形方框里面。使用蒙特卡洛方法,随机在这个矩形里面产生大量随机点(数量为N),计算有多少点(数量为count)落在红色区域内(判断条件为y<x**3),count/N就是落在红色区域的点的比例,根据相应比例即可求出红色区域的面积。代码如下:
x = np.linspace(0, 2, 1000)
y = x ** 3
plt.plot(x, y)
plt.fill_between(x, y, where=(y >0), color='red', alpha=0.5)

N = 10000 #样本点的总量为10000,越大估算出来的结果越精确
points = [[xy[0] * 2, xy[1] * 8] for xy in np.random.rand(N, 2)]#   np.random.rand(N,2)表示产生N行2列的样本点,即N个2维样本点

plt.scatter([x[0] for x in points], [x[1] for x in points], s=5, c=np.random.rand(N), alpha=0.5)
plt.show()
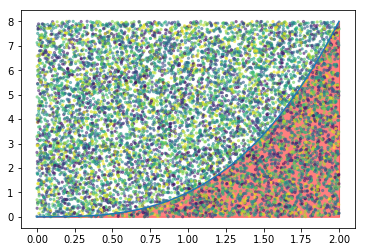
下面为估算有多少个点落在红色区域,并估算其面积。
count = 0
for xy in points:
    if xy[1] < xy[0] ** 3:
        count += 1
print((count / N) * (2 * 8))
结果:
利用积分计算可知该红色区域的精确面积为4,如果样本点设置为1000,估算结果为4.24,如果样本点设置为10000,估算结果为3.968,所以样本点越多,估算越精确。