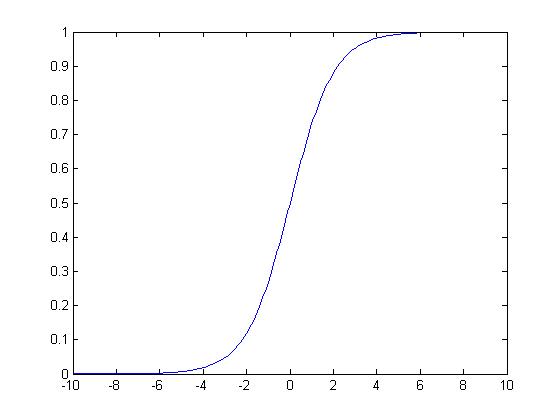
sigmoid函数图像
x=-10:0.1:10; y=sigmf(x,[1 0]); plot(x,y)
画出的图像如下所示:
怎么将Y轴放在中间呢,而不是在左边?
即如何得到这种效果呢?
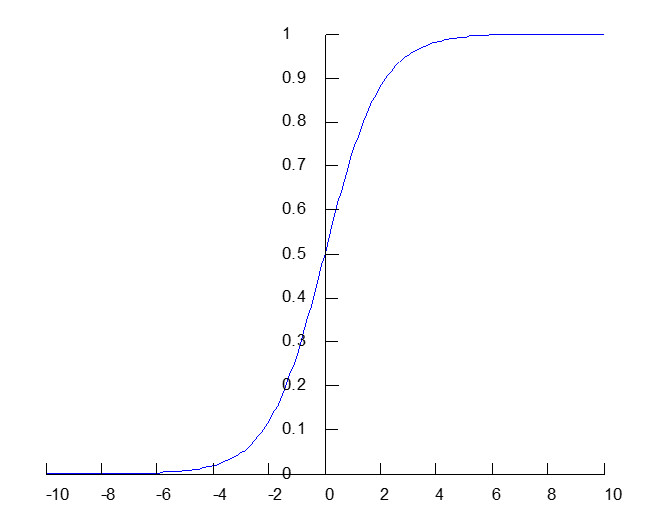
方法:新建一个函数:xyplot.m
%作用:将Y坐标轴放在中间
function xyplot(x,y)
% PLOT
if nargin>0
if nargin == 2
plot(x,y);
else
display(' Not 2D Data set !')
end
end
hold on;
% GET TICKS
X=get(gca,'Xtick');
Y=get(gca,'Ytick');
% GET LABELS
XL=get(gca,'XtickLabel');
YL=get(gca,'YtickLabel');
% GET OFFSETS
Xoff=diff(get(gca,'XLim'))./40;
Yoff=diff(get(gca,'YLim'))./40;
% DRAW AXIS LINEs
plot(get(gca,'XLim'),[0 0],'k');
plot([0 0],get(gca,'YLim'),'k');
% Plot new ticks
for i=1:length(X)
plot([X(i) X(i)],[0 Yoff],'-k');
end;
for i=1:length(Y)
plot([Xoff, 0],[Y(i) Y(i)],'-k');
end;
% ADD LABELS
text(X,zeros(size(X))-2.*Yoff,XL);
text(zeros(size(Y))-3.*Xoff,Y,YL);
box off;
% axis square;
axis off;
set(gcf,'color','w');
set(gca,'FontSize',20);
运行完代码
x=-10:0.1:10; y=sigmf(x,[1 0]); plot(x,y)
之后
输入 xyplot 即可